1 - RocTopple Quick Start
Welcome to RocTopple. RocTopple is an interactive and simple-to-use analysis tool for evaluating block toppling in rock slopes. This quick start tutorial introduces you to the basic features of RocTopple and demonstrates how easily a model can be created and analyzed with the software.
Topics Covered in this Tutorial:
- Project Settings
- Deterministic Analysis
- Input Data
- 3D View
- Viewing Options
- Analysis Results
- Info Viewer
- Water Pressure
- External Force
- Seismic Force
- Sensitivity Analysis
Finished Product:
The finished product of this tutorial can be found in the Tutorial 1 Quick Start.rtop file, which can located by selecting File > Recent Folders > Tutorials Folder in the RocTopple main menu.
1.0 Introduction
RocTopple computes the factor of safety for block toppling or block flexural toppling using geometry generated from the Goodman and Bray method (1976). The slope is defined by:
- The slope face (A)
- The upper slope face (B)
- The overall base inclination (C)
- The toppling joints (D)
Typical problem geometry is illustrated in the figure below.
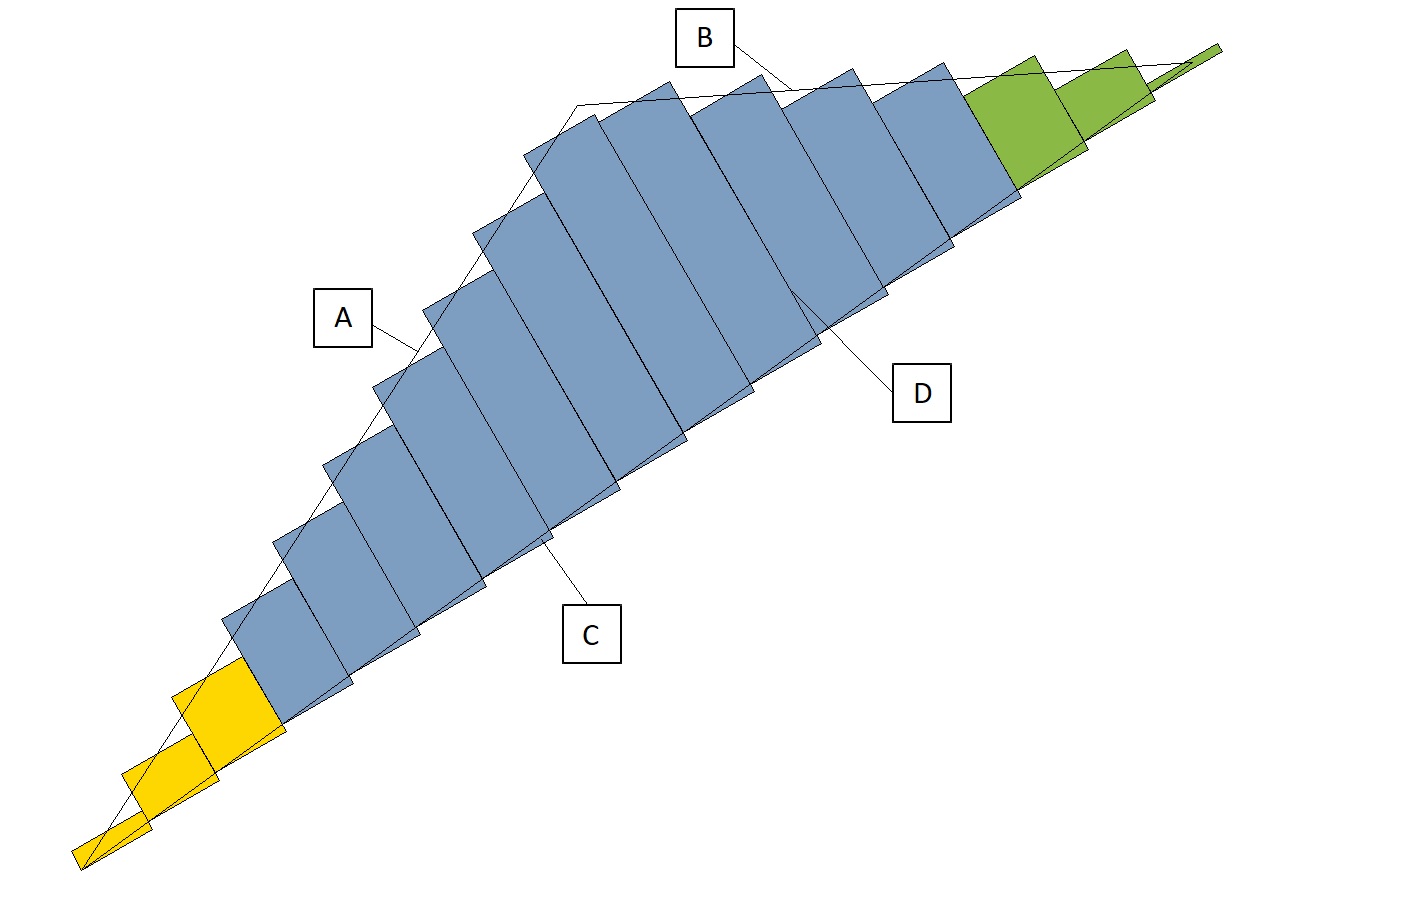
The method assumes uniform spacing of the toppling joints and that the basal failure plane for the blocks is perpendicular to the dip of the toppling joints.
The heights of the blocks are generated such that they follow the slope and upper slope angle. The blocks intersect the slope plane (A) and upper slope plane (B) at the midpoints of the top of the blocks. This method results in the area of the blocks being equal to the area of the triangle formed by the slope (A), the upper slope (B) and the overall base plane (C).
2.0 Creating a New File
- Start RocTopple by selecting Programs > Rocscience > RocTopple > RocTopple from the Windows Start menu.
RocTopple automatically opens a new blank document, which allows you to begin creating a model immediately. If the RocTopple application window is not already maximized, maximize it now so the full screen space is available for use.
If you do NOT see a model on your screen:
- Select: File > New

Whenever a new file is created, the default input data will form valid slope geometry, as shown in the figure below:
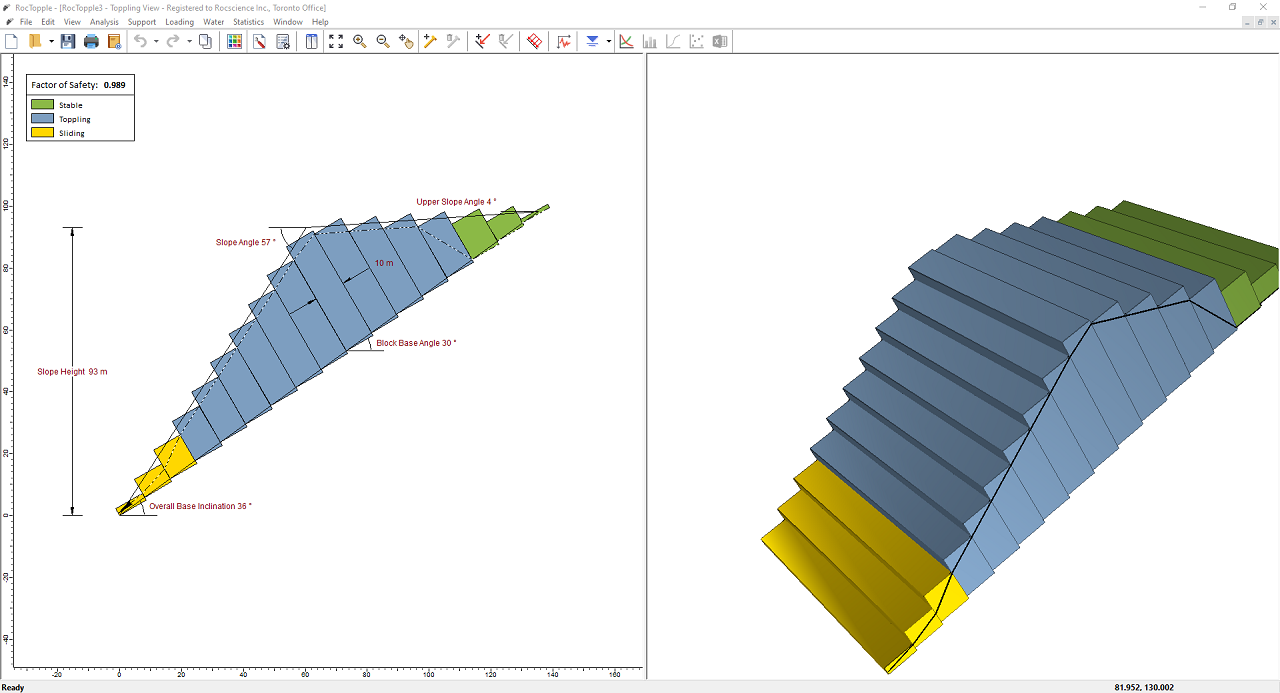
Notice the split screen format of the display. The 2D View shows the slope geometry and the factor of safety, while the 3D View is interactive. Note that the computation is for two-dimensional geometry and assumes unit depth.
3.0 Project Settings
The Project Settings dialog allows you to configure the main analysis parameters for your model (i.e., Analysis Type, Units, etc.). To open the dialog:
- Select: Analysis > Project Settings

3.1 ANALYSIS TYPE
There are two main Analysis Types in RocTopple: Deterministic and Probabilistic. The default selection is Deterministic.
- A Deterministic analysis assumes that all input parameters are “exactly” known. RocTopple computes the Factor of Safety for a single set of input data.
- For a Probabilistic analysis, statistical input data can be entered to account for uncertainty in geometry and joint strength values. Statistics can also be applied to external loads. This results in a Factor of Safety distribution, from which a Probability of Failure is calculated.
For this tutorial, we'll conduct a Deterministic analysis. We'll conduct a Probabilistic analysis in the next tutorial, Tutorial 02 - Probabilistic Analysis in RocTopple.
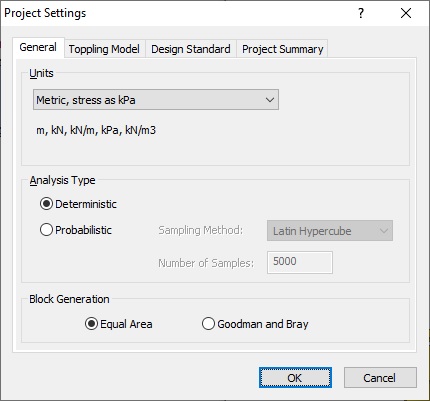
3.2 UNITS
- From the Units drop-down list, select Metric units, stress as kPa.
3.3 SAMPLING AND RANDOM NUMBERS
In RocTopple, all Probabilistic analysis is done using pseudo-random sampling. This means all samples are generated using the same seed, and results can be reproduced.
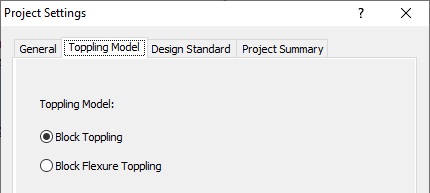
3.4 TOPPLING MODEL
There are two main Toppling Models in RocTopple: Block Toppling or Block Flexure Toppling. For this tutorial, we'll use the Block Toppling model, which is the default setting.
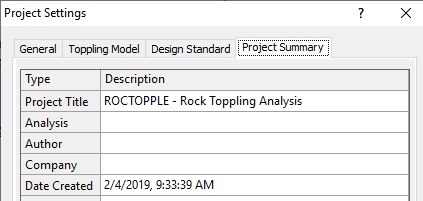
3.5 PROJECT SUMMARY
- Select the Project Summary tab in the Project Settings dialog.
- Enter RocTopple Quick Start Tutorial as the Project Title.
NOTES:
- The Project Summary information can be displayed on printouts of analysis results using the Page Setup option in the File menu and defining a Header and/or Footer.
- You can specify the Author and Company in the dialog so that this information always appears by default in the Project Summary for new files.
- Click OK to save settings and close the Project Settings dialog.
4.0 Input Data
Input Data is the main input data dialog for RocTopple. It allows users to input slope geometry and rock strength parameters. Let’s see what input data is used for the default RocTopple model.
- Select: Analysis > Input Data

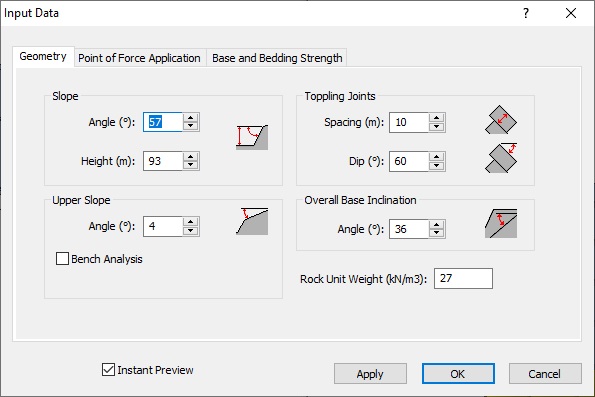
For a Deterministic analysis, the Input Data dialog is organized under two tabs: Geometry and Base and Bedding Strength.
- Examine the Geometry properties. All values are mandatory for input. Do not change any values just yet. We will be coming back to this shortly.
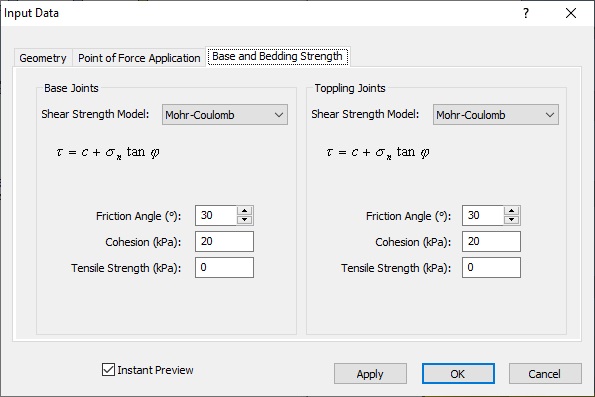
- Select the Base and Bedding Strength tab. In this tab, you define both the strength of the Base Joints (bottom of the blocks) and the strength of the Toppling Joints (between the blocks). There are two strength models available for defining the shear strength of joints: Mohr- Coulomb and Barton-Bandis. By default, the Mohr-Coulomb strength model is selected.
- Select Cancel to close the Input Data dialog.
TIP: Keeping Instant Preview selected allows you to view changes in your model as you change parameters in the Input Data dialog.
External forces are applied to a RocTopple model through other dialogs. These external forces include bolts, loads, and water pressure. We'll look at these options later in the tutorial.
5.0 Analysis Results
The RocTopple analysis is automatically computed when:
- A file is opened, or
- Input data is entered or modified in a dialog (e.g., Input Data), and Apply or OK is clicked in the dialog.
This ensures that the latest analysis results are always displayed.
The primary results from a RocTopple Deterministic analysis are displayed in the legend of the 2D View in the Toppling View, as shown below.
6.0 Info Viewer
A comprehensive listing of input data and analysis results is presented in the RocTopple Info Viewer. To access the Info Viewer:
- Select: Analysis > Info Viewer

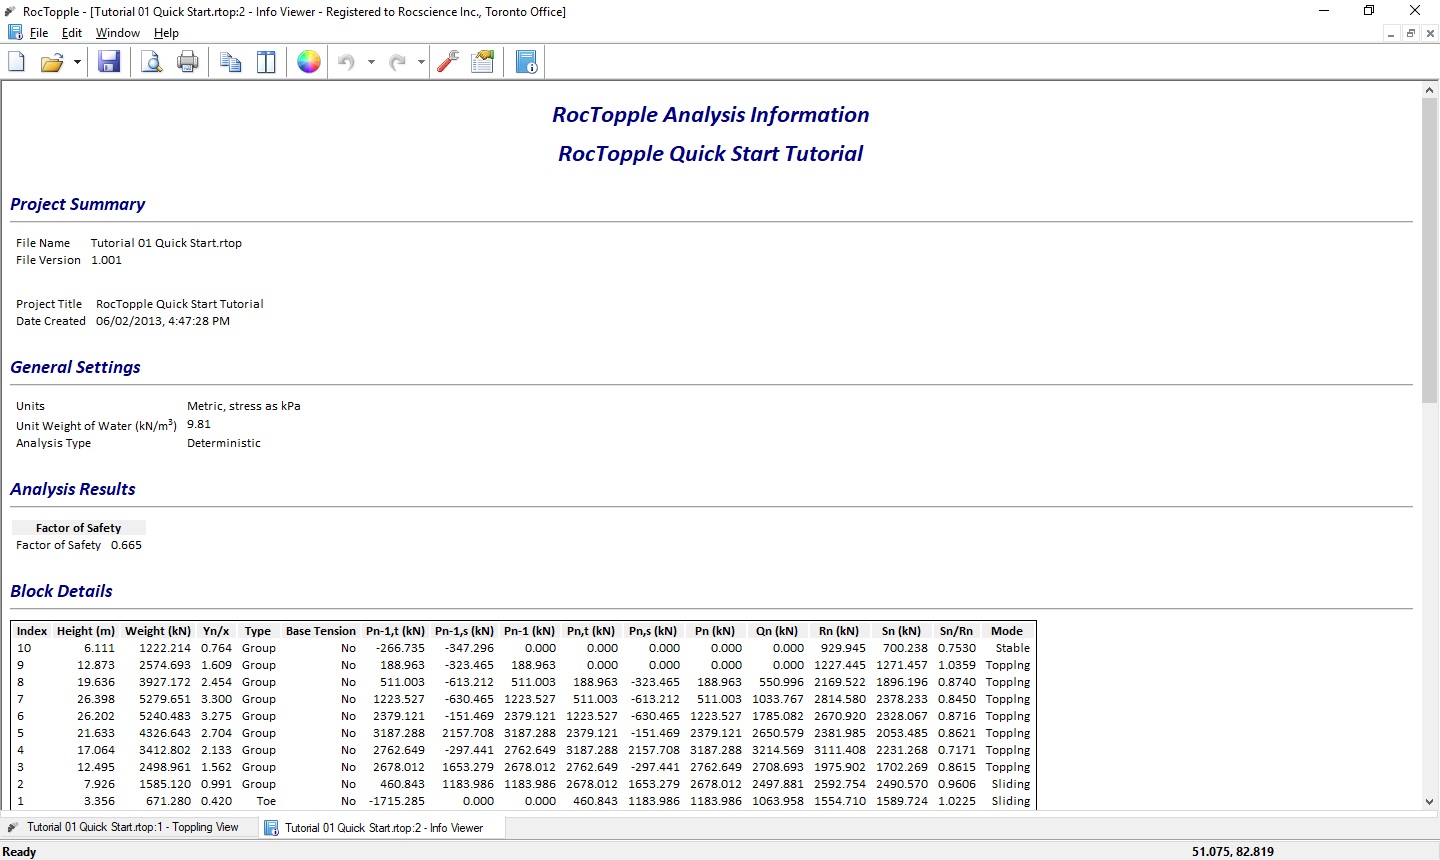
- To view all the data in the Info Viewer, use the scroll bar or the mouse wheel.
- To copy data in the Info Viewer to the Clipboard or save it to a file, right-click in the Info Viewer and select options in the popup menu.
- To close the Info Viewer, click the X in the upper right-hand corner of the view.
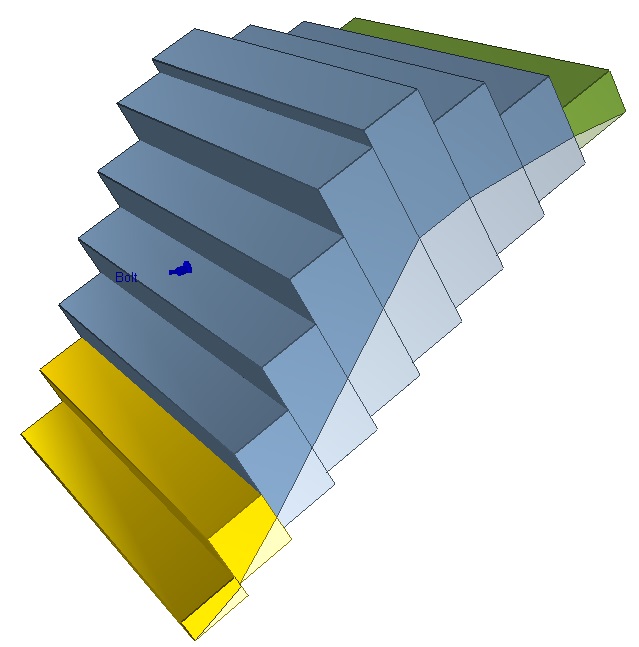
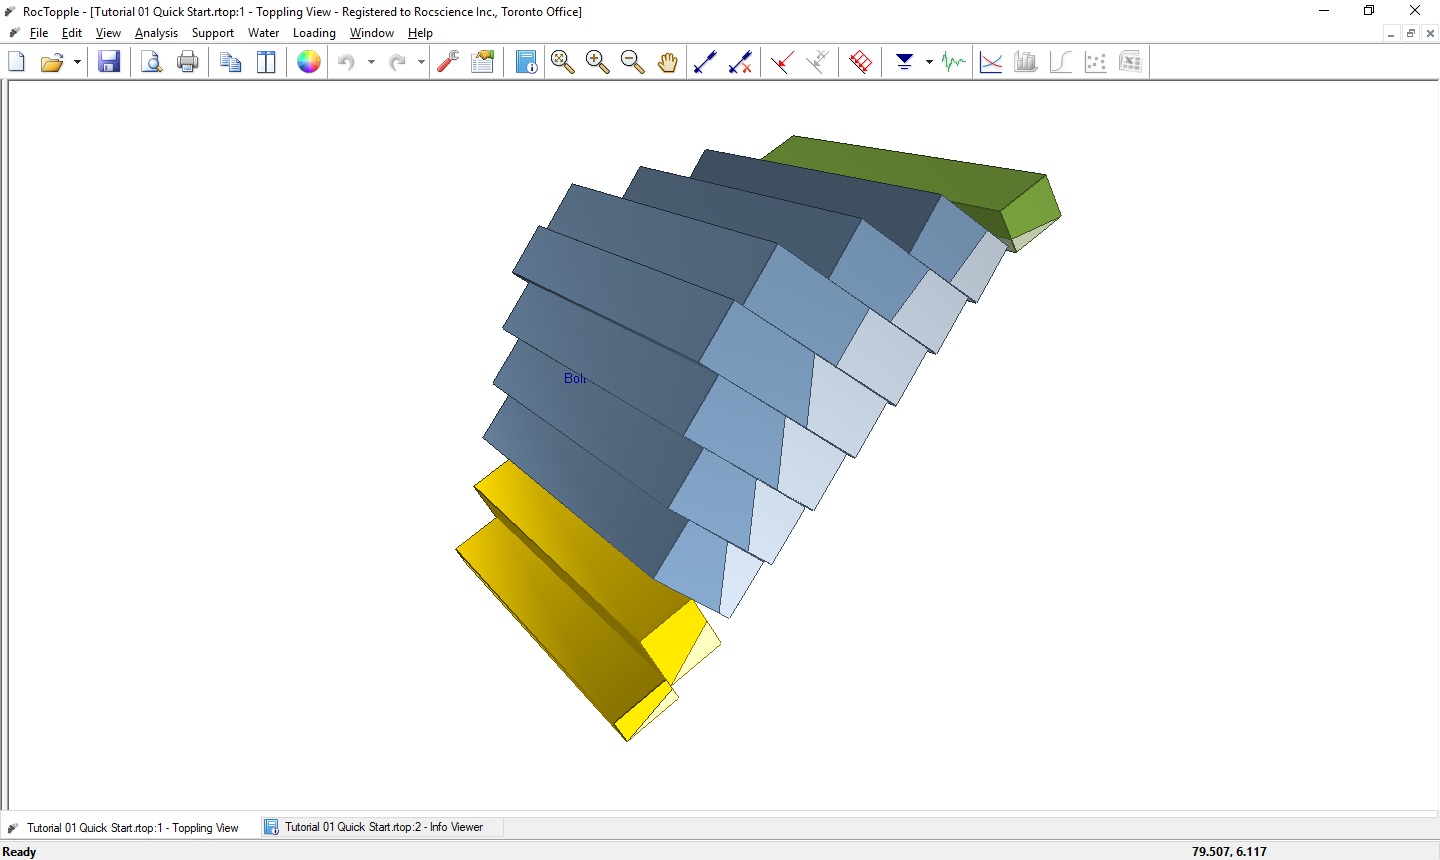
7.0 3D View
The 3D View in RocTopple is interactive and shows the critical failure mode of blocks at the point of failure. As shown in the figure below, the 3D View is isometric by default.
7.1 MOVING BLOCKS
- Double-click on the 3D View to maximize it.
- To see how each block would fail, first hover the mouse over the slope. When the cursor changes to a “two-way arrow” , left-click and drag the mouse down to see the blocks move.
- To reset the blocks to their original positions, left-click and drag the mouse up or select Reset Slope in the right-click menu.
TIP: The blocks can also be moved by scrolling the mouse wheel.
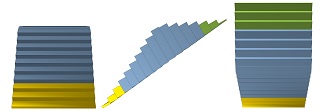
7.2 VIEW OPTIONS
The slope can be viewed in the 3D View from multiple perspectives.
To rotate the slope:
- Left-click on the background (white space) and drag the mouse. Notice the cursor changes to .
To view the 3-D slope in other orientations:
- Select Display Orientations in the right-click menu.
You can see the slope displayed in the front, right, and top orientations as shown below.
8.0 Re-Sizing the Views
8.1 CHANGE THE RELATIVE SIZE OF THE VIEWS
You can change the relative size of the 2D View and 3D View.
- To maximize the size of any pane, double-click the mouse inside the pane.
- To restore the double-pane view, double-click in the maximized view.
- To re-size the panes, click and drag the vertical divider between the two panes.
TIP: If you've re-sized the panes and want to quickly restore the default display, double-click in any pane to maximize the view, then double-click again to restore the default display.
8.2 ZOOM AND PAN
The following Zoom and Pan options are available for both the 2D View and the 3D View:
- Zoom Extents – Resets the model to its default size and location in the view.
- Zoom In – Zooms in to 90 % of the original area.
- Zoom Out – Zooms out to 111% of the original area.
- Pan – Translates the model left, right, up, or down within the view.
The zoom and pan options are available on the toolbar , on the View menu, and through various keyboard and mouse shortcuts. Shortcuts include:
- Rotate the mouse wheel forward or backward to zoom in or out in the 2D View.
- The function keys F2, F4 and F5 are shortcuts to Zoom Extents, Zoom Out, and Zoom In, respectively.
- A shortcut to Pan is to click and hold the mouse wheel and drag to pan the model within the view.
9.0 Changing Input Data
Now let's change the input data to model a different slope.
9.1 INPUT DATA
- Select: Analysis > Input Data
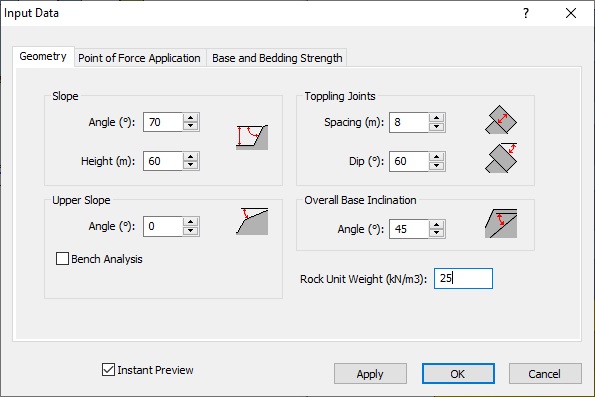
Select the Geometry tab in the Input Data dialog and enter the following data.
Slope Angle
70°
Slope Height
60m
Upper Slope Angle
0°
Toppling Joint Spacing
8m
Toppling Joint Dip
60°
Overall Base Inclination
45°
Rock Unit Weight
25kN/m3
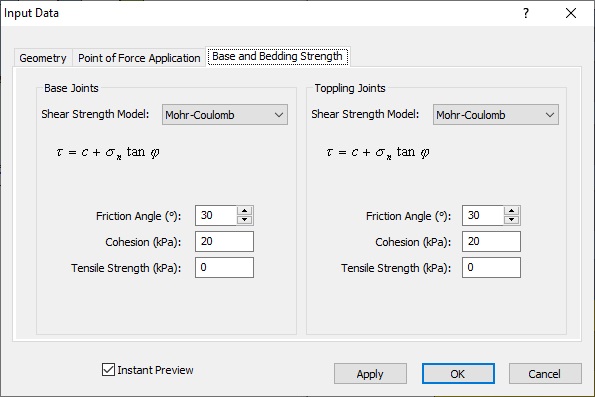
Select the Strength tab in the Input Data dialog and enter the following data for both the Base Joints and Toppling Joints.
Shear Strength Model
Mohr-Coulomb
Joint Friction Angle
30°
Joint Cohesion
20kPa
Notice that, with Instant Preview checked, RocTopple automatically updates the results in the 2D View and 3D View. The Factor of Safety now should be 0.8.
- Select OK to close the dialog.
The slope formed with the new input data is displayed below:
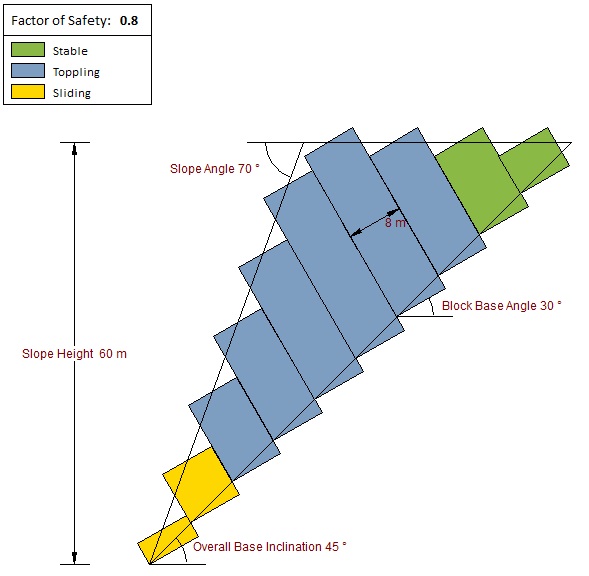
Results indicate that, at a shear strength reduction factor of 0.8, blocks 1 and 2 are sliding critical, blocks 3 – 8 are toppling critical, and blocks 9 and 10 are stable.
9.2 WATER PRESSURE
By default, water pressure is NOT applied to a RocTopple model and the analysis is therefore applicable to a DRY slope. Let's add water pressure to the analysis, using the Water Pressure dialog. To open the dialog:
- Select: Water > Water Pressure Options

- In the Water Pressure dialog, select the Pore pressure in joints option. This allows you to specify a percent fill in the toppling joints.
- Set % Fill = 50.
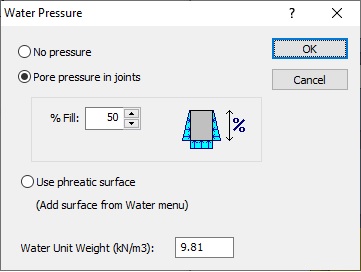
- Click OK.
The Factor of Safety is now 0.715.
Notice that the blocks now have lighter colored areas to indicate the water level.
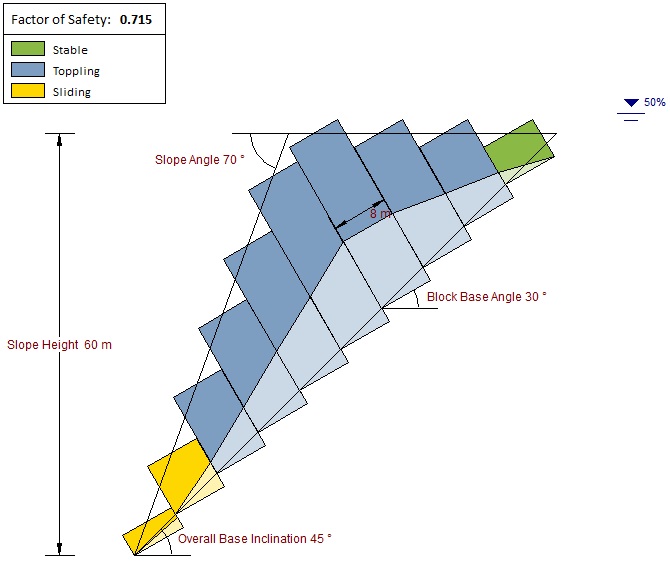
The symbol at the top right of the 2D View shows that the joints are 50% filled in length with water.
- For easy access to the Water Pressure dialog from the view, right-click on this symbol and select Modify Water Pressure in the popup menu.
9.3 BOLT
Now let’s add a single bolt that will add to the resisting force of the toe block. To add a bolt, open the Add Spot Bolt dialog by:
- Select: Support > Add Bolt

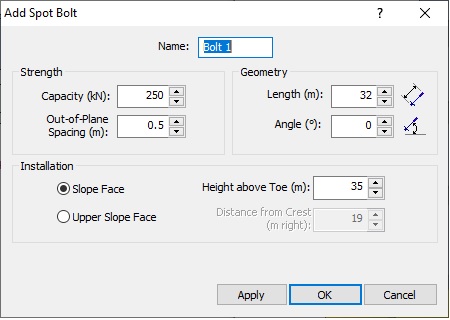
In the dialog, enter the following:
Capacity 250kN
Height above Toe 35m
Angle 0°
Length 32m
Spacing 0.5m
The Factor of Safety (with water pressure still applied) increases to 0.75.
- Click OK to close the dialog.
9.4 SEISMIC FORCE
Now we will include seismic force in the analysis, using the Seismic Load dialog. To open the dialog:
- Select: Loading > Seismic Load
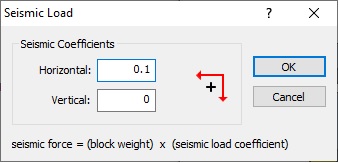
- Enter a Horizontal Seismic Coefficient of 0.1.
- Click OK.
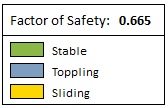
The Factor of Safety is now 0.665.
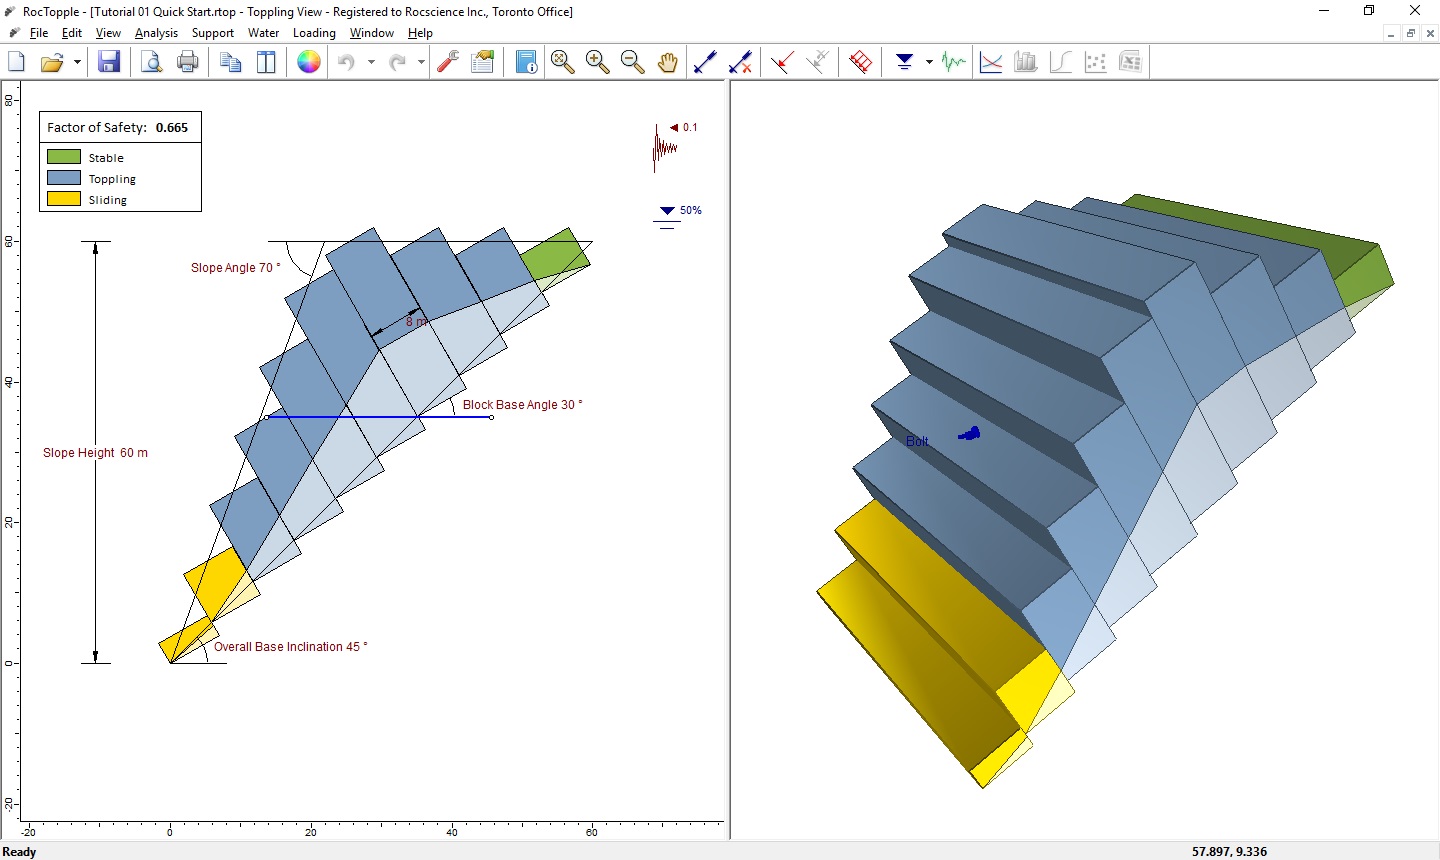
The seismic symbol at the top-right of the 2D View indicates that a horizontal seismic coefficient of 0.1 and to the left is applied on the slope.
- For easy access to the Seismic Load dialog from the view, right-click on the symbol and select Modify Seismic Load in the popup menu.
The Seismic Force (F) is applied to each block as follows:
F = 0.1 * g * m, where 0.1 = horizontal seismic coefficient, g = acceleration due to gravity, and m = mass of the block.
10.0 Sensitivity Analysis
Before we conclude this tutorial, we will demonstrate the Sensitivity Analysis feature of RocTopple.
In a Sensitivity analysis, individual variables can be varied between user-defined minimum and maximum values, while all other input parameters remain constant. This allows you to determine the effect of individual variables on the Factor of Safety.
For the tutorial, we will use a Sensitivity Analysis to prove that increasing the seismic loading in the left horizontal direction decreases the Factor of Safety. Leave the water pressure and bolt attributes as they are.
- Select Sensitivity Analysis
 on the toolbar or the Analysis menu.
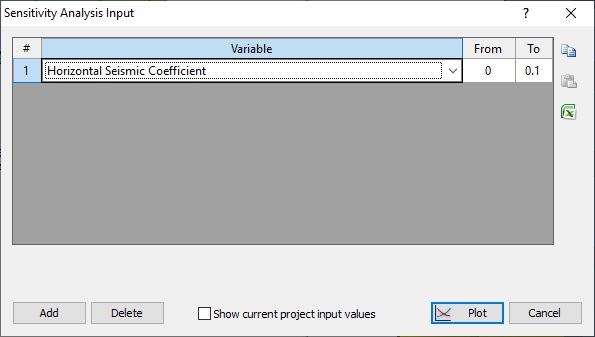
 - In the Sensitivity Analysis Input dialog, click Add to add a sensitivity variable.
- In the Variable column, select Horizontal Seismic Coefficient.
- Change the To value to 0.1 to plot a sensitivity graph ranging from 0 to 0.1.
- Click Plot.
You should see the sensitivity plot displayed in the figure below.
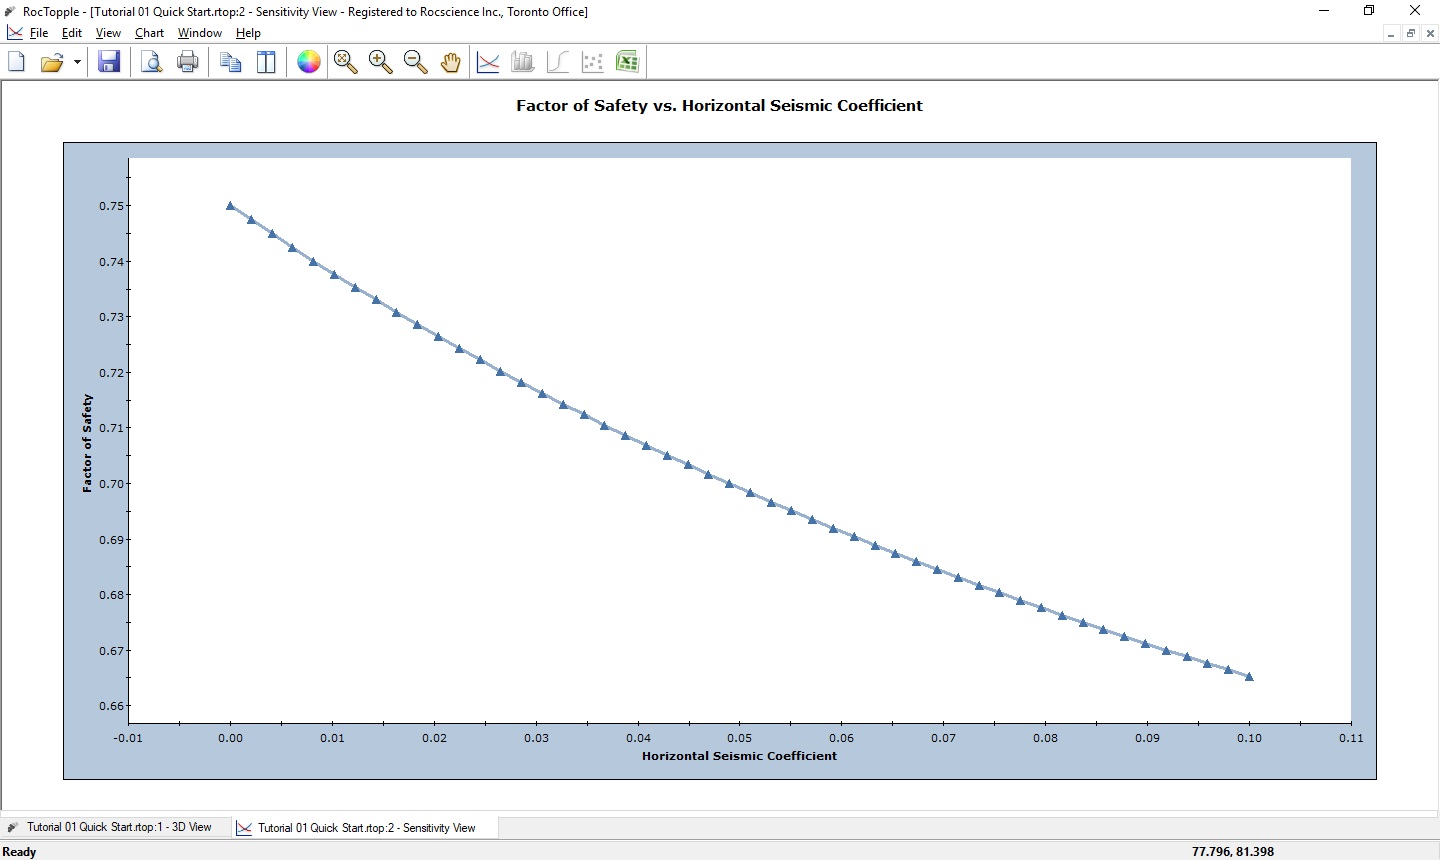
You can clearly see from the graph that the Factor of Safety decreases with an increase in the horizontal seismic coefficient.
This concludes the tutorial. You are now ready to proceed to the next tutorial, Tutorial 02 - Probabilistic Analysis in RocTopple.