2 - Creating a Dips File
1.0 Introduction
This tutorial shows the steps required to create a typical Dips file. Starting with a new blank file, the file which was used for the Tutorial 01 - Dips Quick Start (Example.dips8) is recreated.
Topics Covered in this Tutorial:
- Global Orientation Format
- Quantity Column
- Traverse information
- Extra Columns
Finished Product:
The finished product of this tutorial can be found in the Tutorial 02 Creating A Dips File .dips8 file, located in the Examples > Tutorials folder in your Dips installation folder.
2.0 Model
If you have not already done so, run Dips by double-clicking on the Dips icon in your installation folder. Or from the Start menu, select Programs > Rocscience > Dips > Dips.
If the Dips application window is not already maximized, maximize it now, so that the full screen is available for viewing the model.
Dips comes with several example files installed with the program. These example files can be accessed by selecting File > Recent Folders > Examples Folder from the Dips main menu. This tutorial will use the Example.dips8 file to demonstrate the basic plotting features of Dips.
- Select Recent Folders > Example Folder
 option from the File menu .
 - Open the Example.dips8 file.
You should see the Stereonet Plot View shown in the following figure.
- Switch to the Grid Data view by selecting the Grid Data view tab at the bottom left of the view.
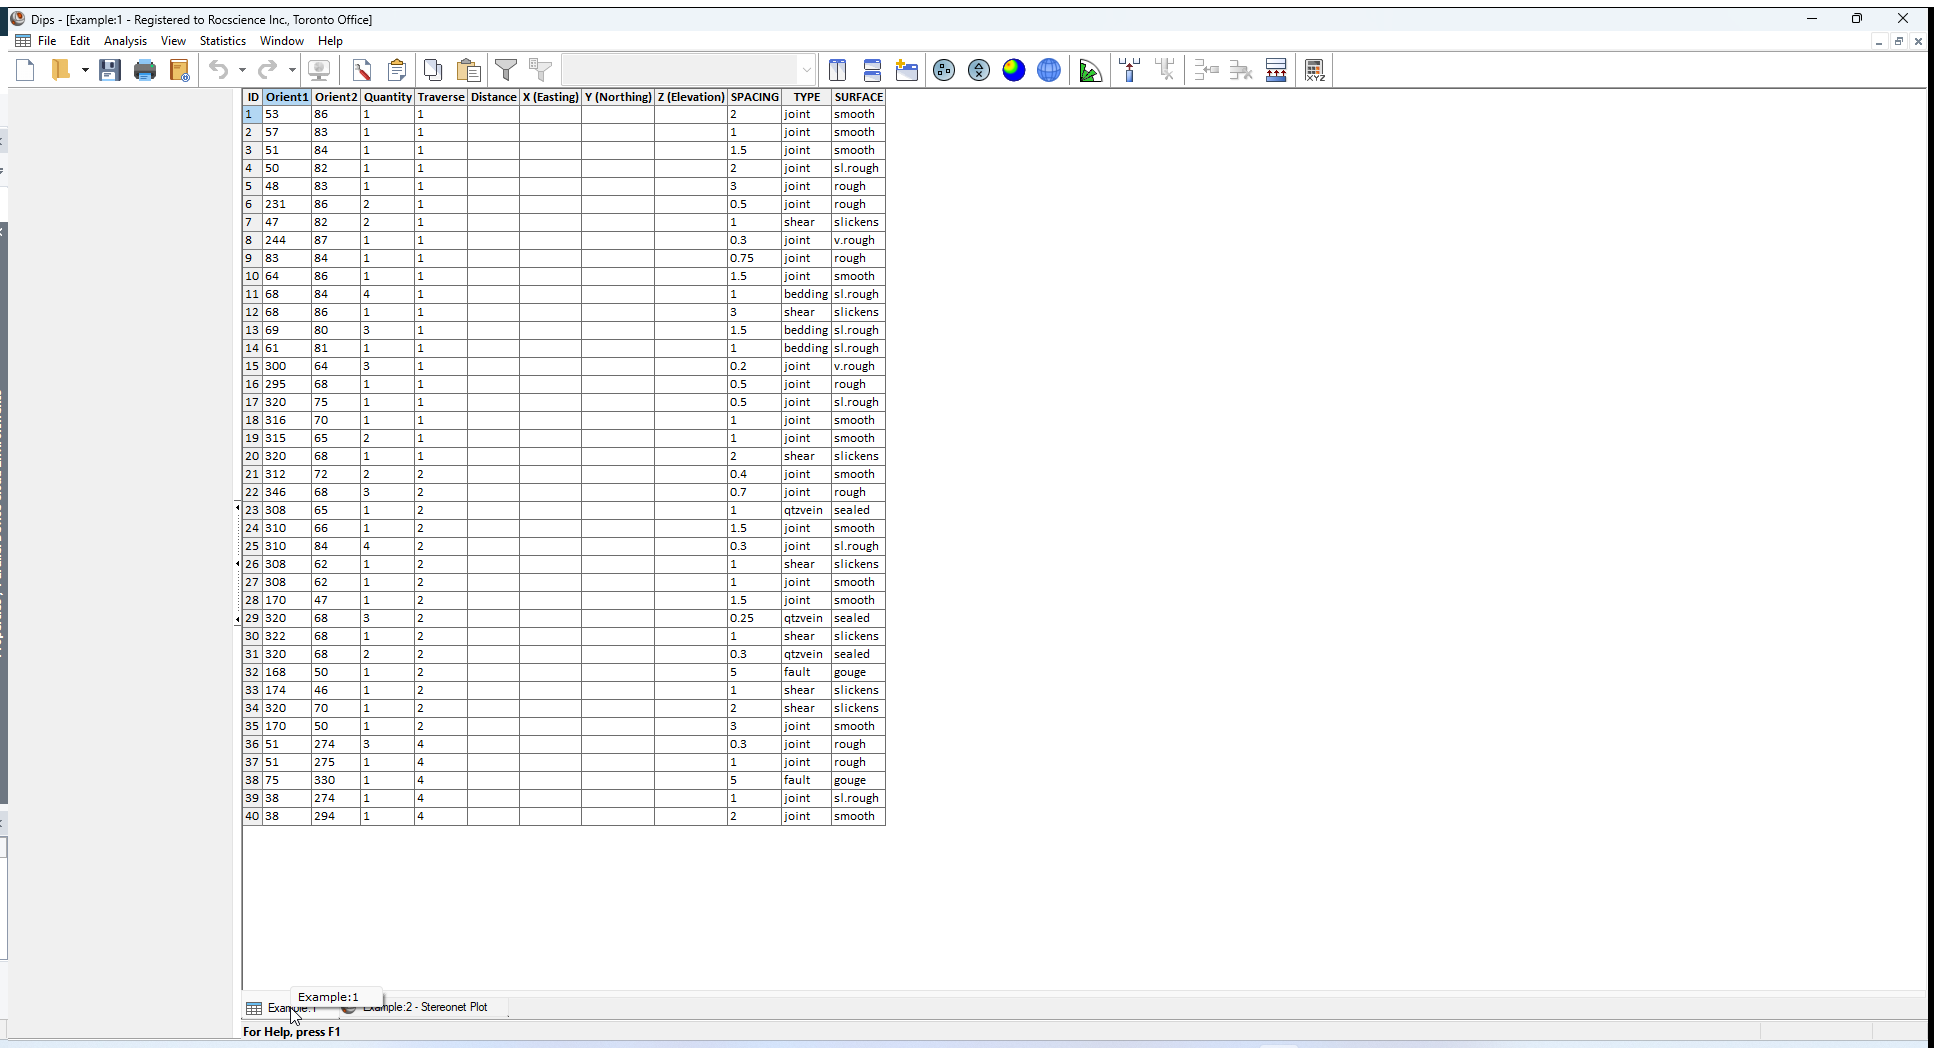
Notice that this file contains the following columns:
- Two Orientation Columns
- A Quantity Column
- A Traverse Column
- A Distance Column
- Three X (Easting), Y (Northing), and Z (Elevation) Columns
- Three Extra Columns (spacing, type, surface)
- When you have finished examining the Example.dips8 data, close the file, and we will discuss how to re-create this file from scratch.
3.0 Creating a New File
To begin creating a new Dips file:
- Select New
 from the toolbar or the File menu.
 - Select Save
 from the toolbar or the File menu.
 - Enter the file name Tutorial 02 Creating A Dips File and save the file.
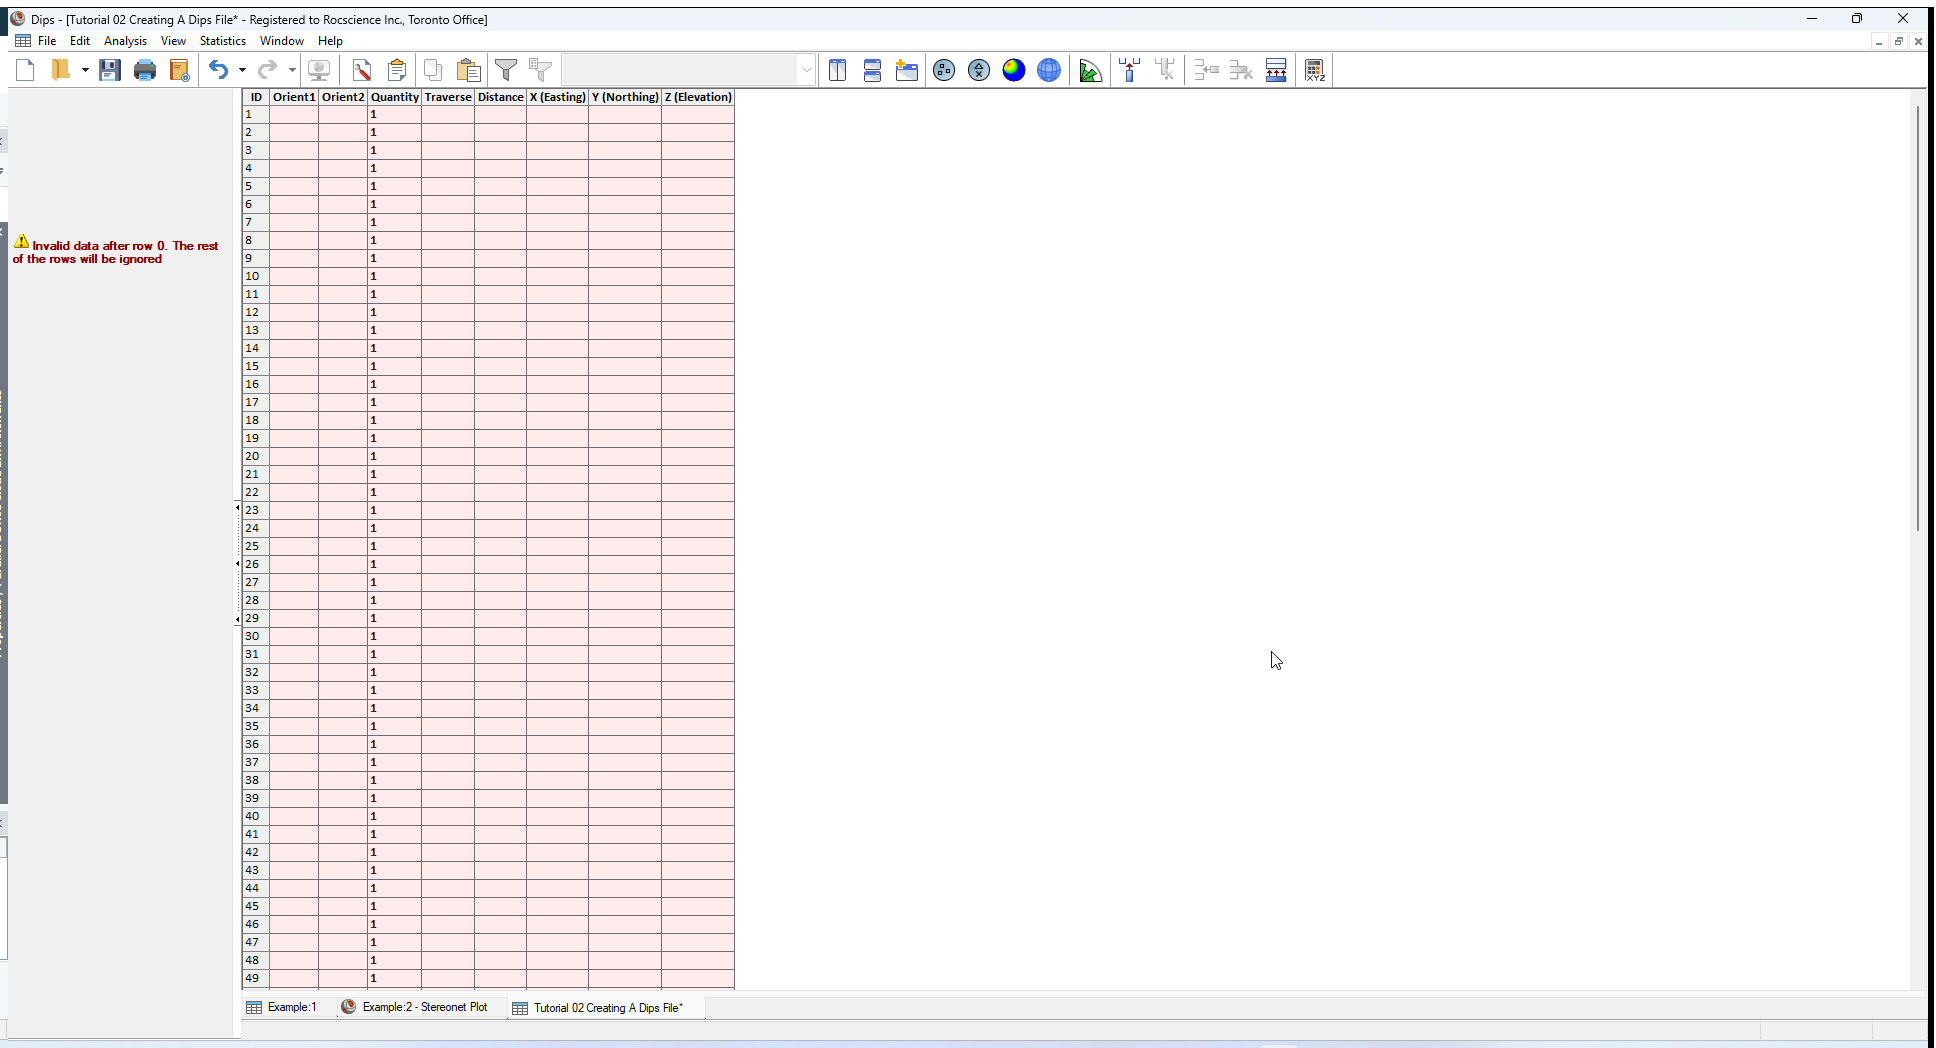
You will see the following blank Dips spreadsheet, which contains:
- Two Orientation Columns
- 100 rows
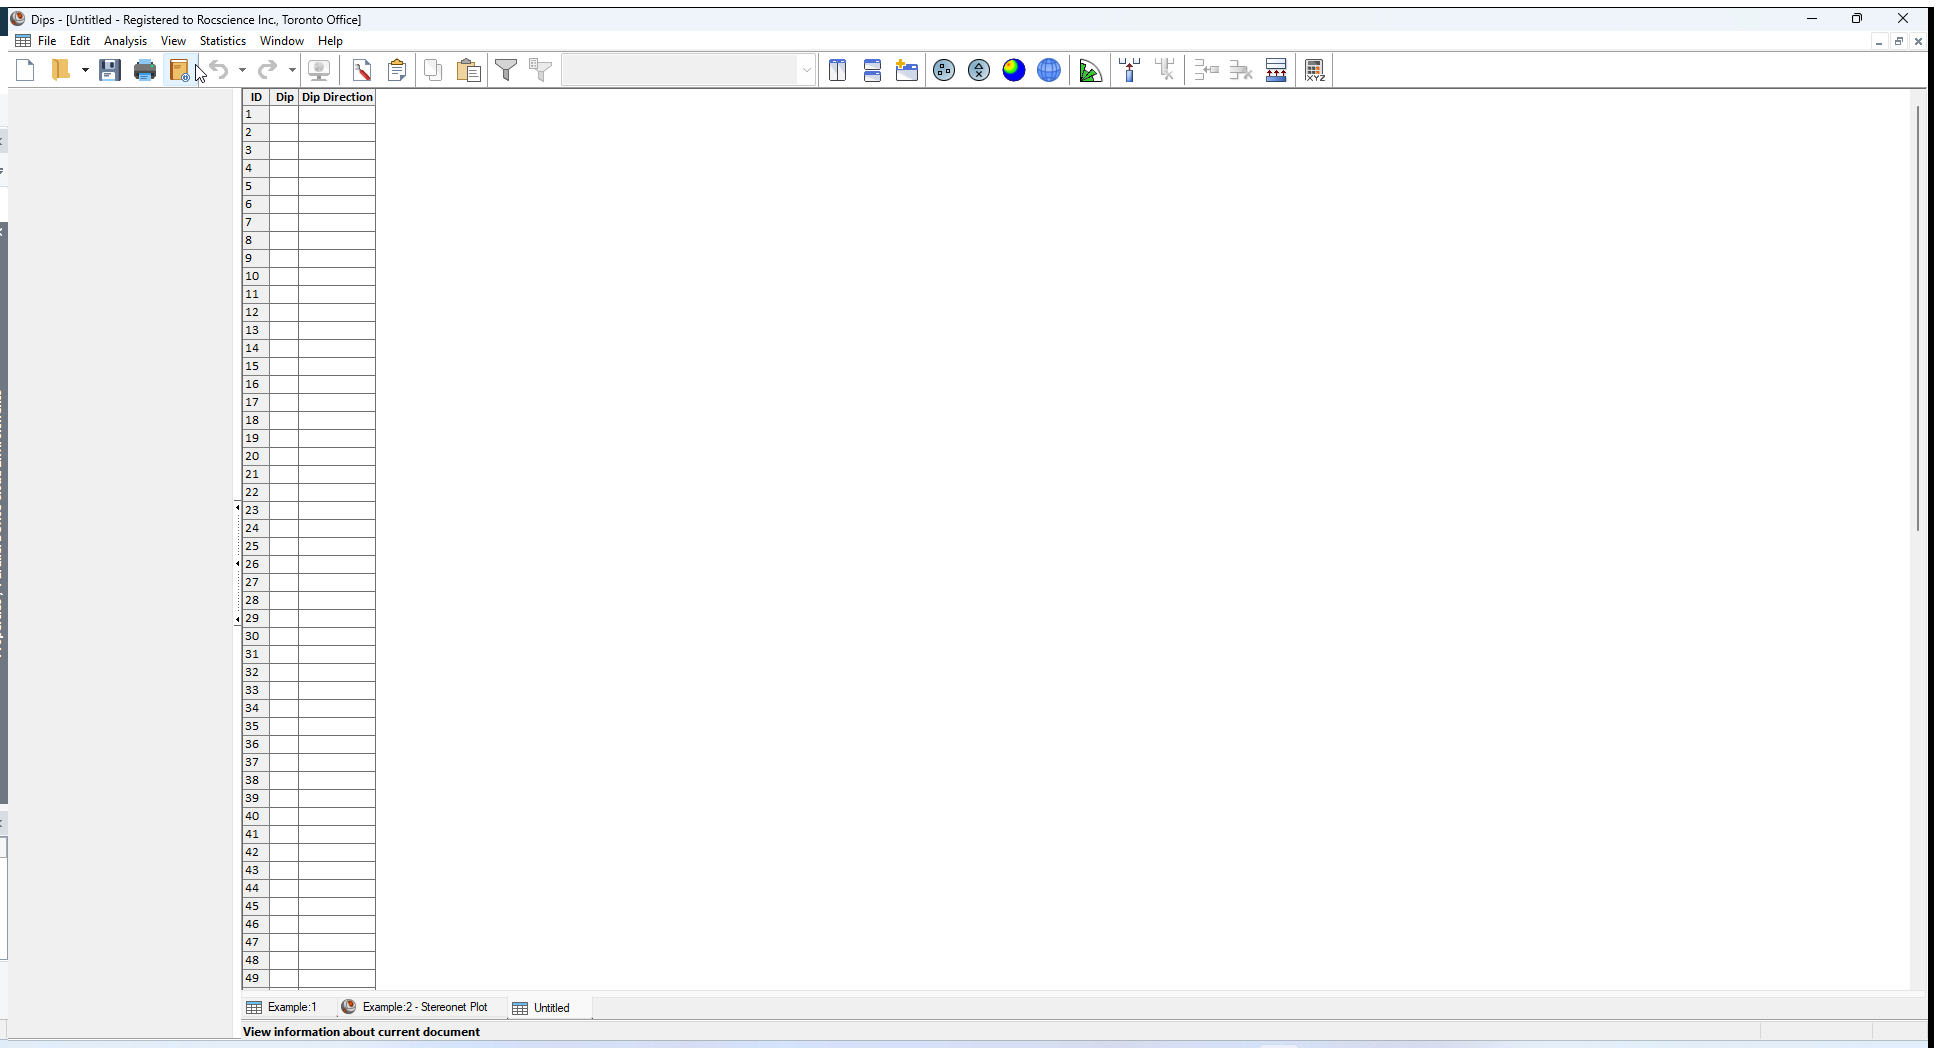
If you have not already, maximize the Grid Data view.
As you can see from the titles of the two Orientation Columns, the default Global Orientation Format for a new Dips file is DIP/ DIP DIRECTION. For this example, we need to change this to STRIKE/DIP (right hand rule). This is done through the Project Settings option.
4.0 Project Settings
When creating a new Dips file, you will generally need to use the Project Settings option before proceeding to enter data.
- Select Project Settings
 from the toolbar or the Analysis menu.
 - The Project Settings dialog will appear.
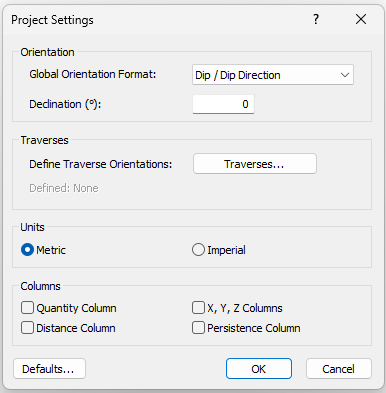
For this example, we need to configure the:
- Global Orientation Format
- Declination
- Quantity Column
4.1 GLOBAL ORIENTATION FORMAT
The Global Orientation Format in the Project Settings dialog determines how Dips will interpret the data in the two Orientation Columns.
For this example, most of our data is in STRIKE/DIP (right hand rule) format.
In the Project Settings dialog:
- Set the Global Orientation Format = Strike (Right) / Dip in the dropdown.
4.2 DECLINATION
In the Project Settings dialog:
- Enter a Declination = - 5.5 degrees .
The Declination is typically used to correct for magnetic declination, but can be used to adjust to grid north.
Note the following changes to the spreadsheet in the Grid Data view:
- The titles of the two Orientation Columns are now Strike (Right) and Dip.
- The Quantity column is added after the Orientation Columns.
4.3 QUANTITY COLUMN
A Quantity Column in a Dips file allows you to record single data entries which refer to multiple identical features having the same orientation.
In the Project Settings dialog:
- Select the Quantity Column checkbox.
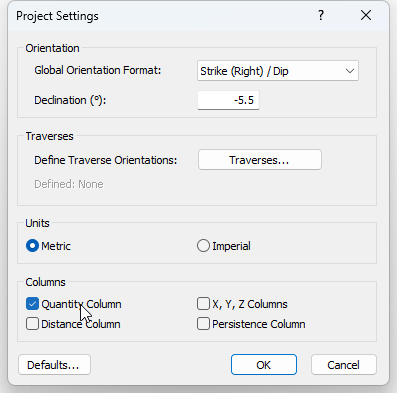
- Select OK.
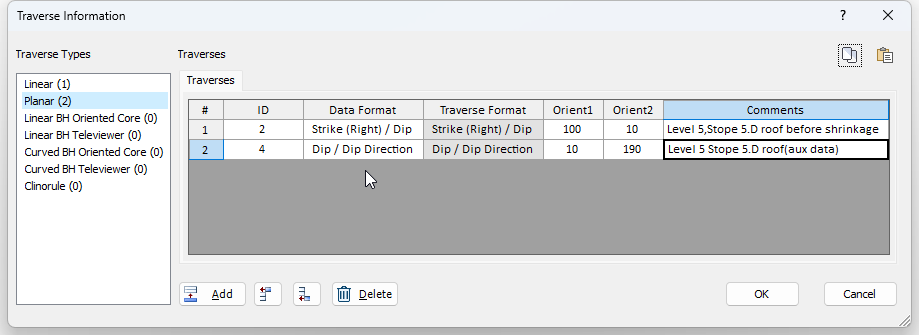
5.0 Traverses
Traverses are used to group data units; to weight the data to correct for measurement bias; and to process oriented core data.
To define Traverses:
- Select Analysis > Traverses from the menu (or through the Project Settings dialog).
- The Traverse Information dialog will appear.
5.1 TRAVERSE TYPE
Seven Traverse Types are available in Dips:
- Linear
- Planar
- Linear BH Oriented Core
- Linear BH Televiewer
- Curved BH Oriented Core
- Curved BH Televiewer
- Clinorule
See the Traverses topic for more information about Traverse Types in Dips.
5.2 ADDING TRAVERSES
The Example.dips8 file uses four Traverses: one Linear, two Planar, and one Linear Borehole Oriented Core.
We will create these as follows:
- Select the Linear Traverse Type.
- Select the Add
 button.
 - In the Add Rows dialog, enter Number of Rows to Add = 1. Select OK to add 1 row.
- In the first row of the Linear Traverses tab enter:
- ID = 1
- Data Format = Strike (Right) / Dip
- Trend = 120
- Plunge = 30
- Comments = Level 3,Stope 3.A,sublevel 310
- Select the Planar Traverse Type.
- Select the Add button.
- In the Add Rows dialog, enter Number of Rows to Add = 2 . Select OK to add 2 rows.
- In the first row of the Planar Traverses tab enter:
- ID = 2
- Data Format = Strike (Right) / Dip
- Orient1 = 100
- Orient2 = 10
- Comments = Level 5,Stope 5.D roof before shrinkage
- In the second row of the Planar Traverses tab enter:
- ID = 4
- Data Format = Dip / Dip Direction
- Orient1 = 10
- Orient2 = 190
- Comments = Level 5 Stope 5.D roof(aux data)
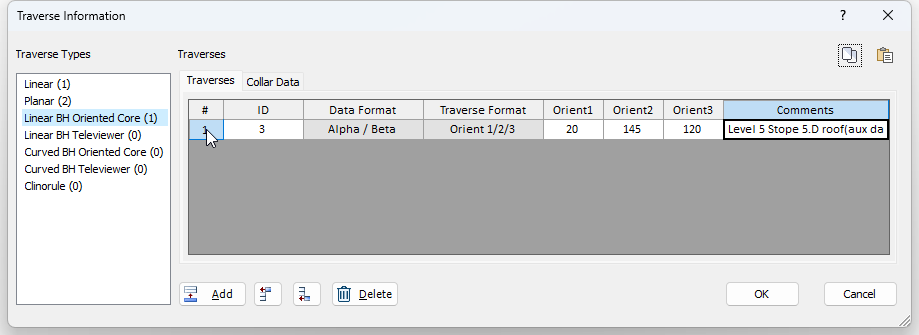
- Select the Linear BH Oriented Core Traverse Type.
- Select the Add button.
- In the Add Rows dialog, enter Number of Rows to Add = 1. Select OK to add 1 row.
- In the first row of the Linear BH Oriented Core Traverses tab enter:
- ID = 3
- Orient1 = 20
- Orient2 = 145
- Orient3 = 120
- Comments = Level 5 Stope 5.D roof(aux data)
- In the first row of the Linear BH Oriented Core Traverses tab enter:
- ID = 3 (to match the Traverses tab)
- X = 0
- Y = 0
- Z = 0
- Total Depth = 120
- Select OK when all four Traverses have been defined.

5.3 TRAVERSE ID
The Traverse ID can be any alpha-numeric value. When you initially add Traverses, they are automatically assigned default ID codes based on the Traverse type. After Traverses have been added, you can change the ID to any user-defined alpha-numeric code.
Each Traverse must have its own unique ID.
5.4 DATA FORMAT
The Traverse Data Format is very important, because it allows you to combine mixed orientation formats in the same Dips file. Whenever the Traverse Data Format is different from the Global Orientation Format, Dips will interpret the orientation data for the Traverse according to the Data Format.
In this example:
- Traverses 1 and 2 have the same data format as the Global Orientation Format: Strike (Right)/Dip.
- Traverse 3 is a Linear BH Oriented Core Traverse. For oriented core Traverses, the Data Format is always Alpha / Beta, since orientations are measured in terms of local Alpha and Beta angles on the oriented core. See the Oriented Core Borehole Data topic for detailed discussion of oriented core Traverses.
- Traverse 4 uses a different orientation format from the Global Orientation Format. In this case, the data on Traverse 4 is in Dip/Dip Direction format.
5.5 TRAVERSE FORMAT
The Traverse Format refers to the orientation of the Traverse itself. The orientations required to define the Traverse orientation depend on the Traverse Type, and may also depend on the Traverse Format.
- Traverse 1 is a Linear Traverse. For a Linear Traverse, the Traverse Format is ALWAYS Trend/Plunge.
- Traverse 2 is a Planar Traverse. For a Planar Traverse, the Traverse Format is the same as the Data Format, in this case Strike(Right)/Dip (i.e., Orient1 = Strike, Orient2 = Dip).
- Traverse 3 is a Linear Borehole Oriented Core Traverse, which requires THREE orientations to define. See the Linear Borehole Oriented Core Traverses topic for details.
- Traverse 4 is a Planar Traverse. In this case, the Data Format is Dip/DipDirection therefore the Orient1 and Orient2 values are also in Dip/DipDirection format (i.e., Orient1 = Dip, Orient2 = Dip Direction).
5.6 TRAVERSE COMMENT
Optional Comments can be added for each Traverse, to further identify / describe each Traverse.
You may inspect the original Example.dips8 file to view the comments added for these four Traverses.
5.7 TRAVERSE COLUMN
When you are finished entering the Traverse Information, you will see that:
- A Traverse column has been added to the spreadsheet in the Grid Data view, after the Quantity column. The Traverse column is for recording the Traverse ID of each data unit. In this case the Traverse ID numbers are 1, 2, 3, and 4.
Also notice that the titles of the two Orientation Columns are now Orient 1 and Orient 2, instead of Strike (Right) and Dip. Since there are mixed orientation formats in this data file (remember that the Traverse Format for Traverse 4 is Dip / Dip Direction while the Global Orientation Format is Strike (Right) / Dip), the titles of the Orientation columns are simply Orient1 and Orient2, to avoid misinterpretation of the data.
5.8 DISTANCE AND X, Y, Z COLUMNS
Also note that:
- A Distance column has been added to the spreadsheet in the Grid Data view, after the Traverse column.
- Three X (Easting), Y (Northing), and Z (Elevation) columns have been added to the spreadsheet in the Grid Data view, after the Distance column.
6.0 Extra Column
In Dips, any columns AFTER the two mandatory Orientation Columns, and the optional Quantity and Traverse Columns (if present), are referred to as Extra Columns.
Extra Columns can be used to store any other quantitative or qualitative data that you wish to record.
Recall that the Example.dips8 file used three Extra Columns:
- SPACING
- TYPE
- SURFACE
Extra Columns are added to the Dips spreadsheet with the Add Column  option in the Edit menu.
Since Extra Columns can only be added AFTER the predefined columns (i.e., Orientation, Quantity, Traverse, Distance, and X, Y, Z), in order for the Add Column option to be enabled, the current highlighted spreadsheet cell must be either:
- In an existing Extra Column, or
- In the last of the Orientation, Quantity, Traverse, Distance, or X, Y, Z, as applicable.
In this case, since no Extra Columns currently exist:
- Click the mouse in the Traverse column. The Add Column option will be enabled.
- Select Add Column option from the Edit menu.
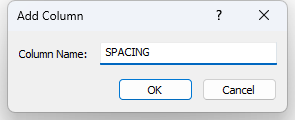
- In the Add Column dialog, enter the Column Name = SPACING
- Select OK to add the Extra Column to the Grid Data spreadsheet.
Now let’s add the TYPE and SURFACE Extra Columns. An alternative way to add an Extra Column, is to RIGHT-CLICK on the title of an existing Extra Column, or the LAST of the Orientation, Quantity or Traverse columns, as applicable.
For example:
- Right-click the mouse on the title of the SPACING column which you just created.
- Select Add Column option from the right-click menu.
- In the Add Column dialog, enter the Column Name = TYPE.
- Select OK to add the Extra Column to the Grid Data spreadsheet.
- Right-click the mouse on the title of the TYPE column which you just created.
- Select Add Column option from the right-click menu.
- Enter the Column Name = SURFACE.
- Select OK to add the Extra Column to the Grid Data spreadsheet.
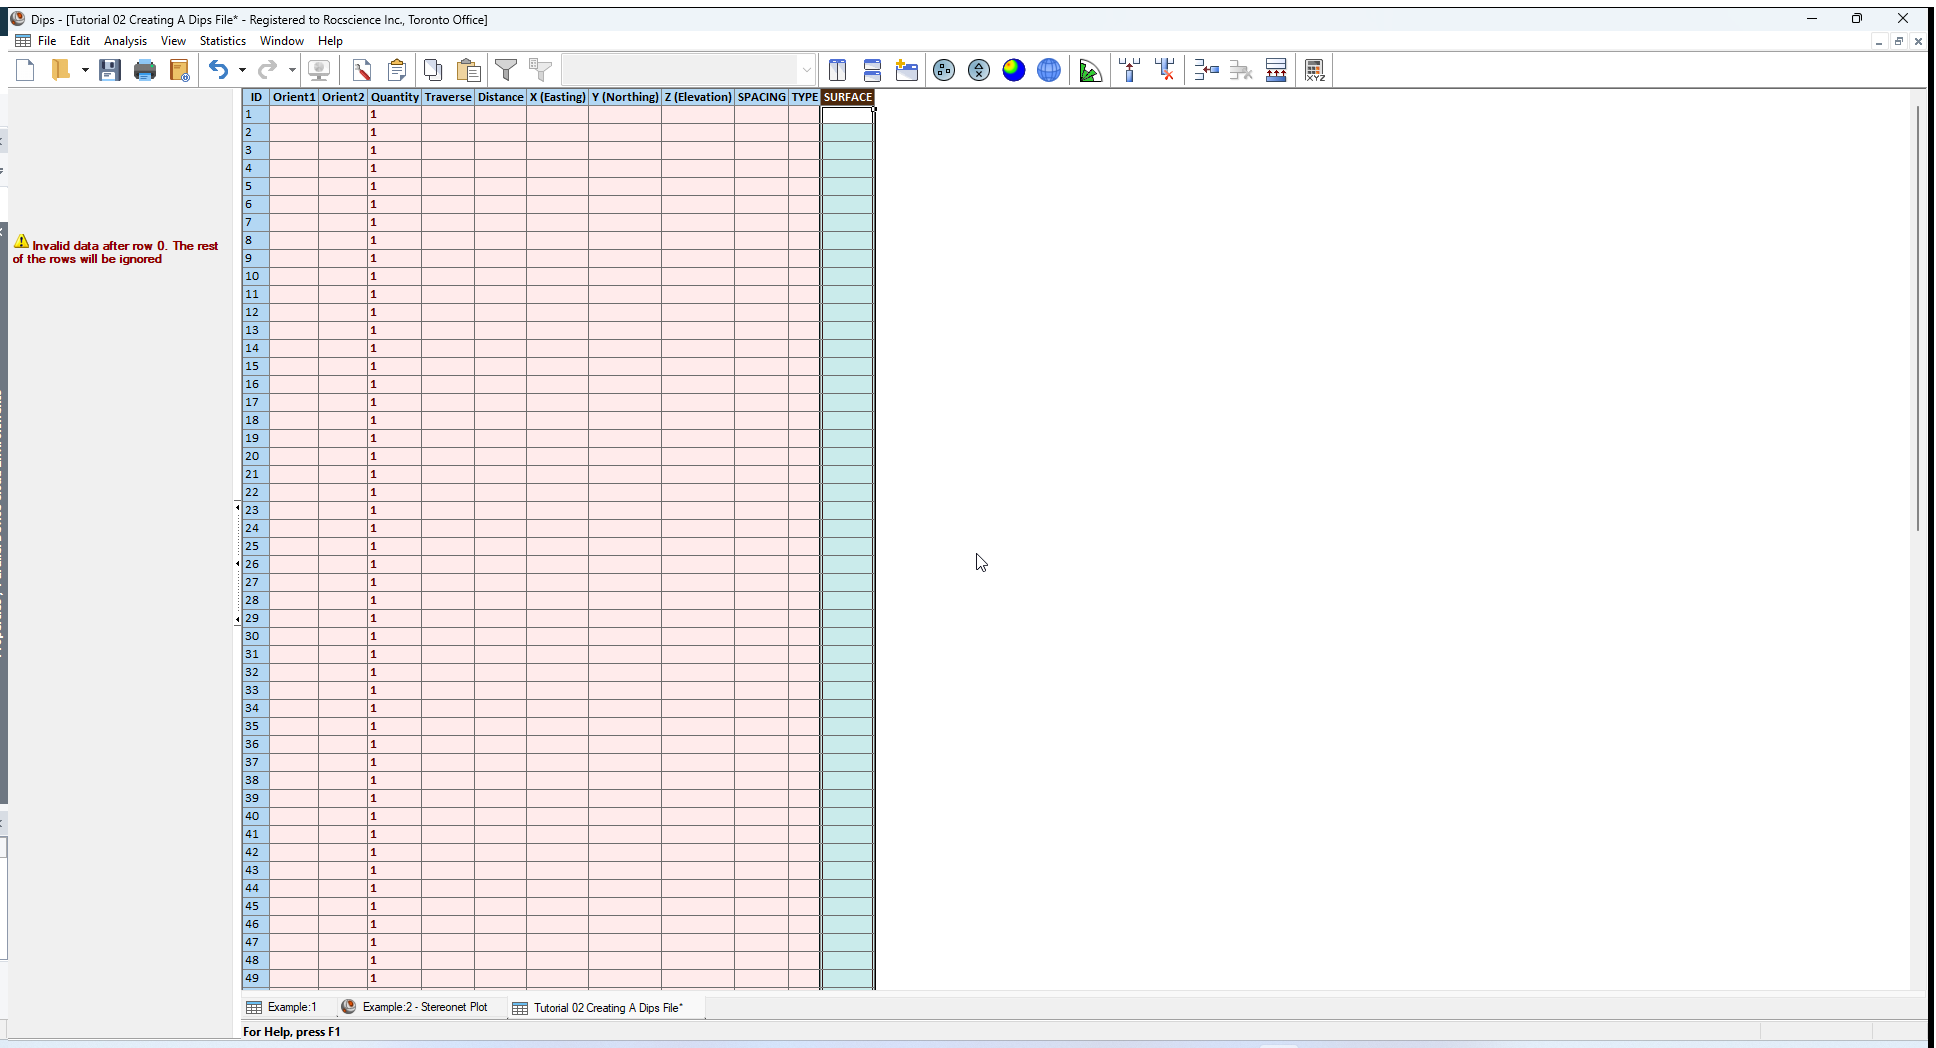
You have now re-created all of the columns of the Example.dips8 file as shown below. You are now ready to start entering data.
7.0 Entering Data
To conclude this tutorial, we will:
- Open the Example.dips8 file and copy the data into our new file.
- Generate contour plots for both files, and hopefully they will be identical!
To view the Example.dips8 file:
- Select File > Recent Folders > Examples Folder from the menu.
- Open the Example.dips8 file and switch to the Grid Data view.
- In the Example.dips8 spreadsheet, click on the ID button at the upper left corner, to select the entire spreadsheet.
- Right-click the mouse anywhere in the Example.dips8 spreadsheet and select Copy
 .
. - Use the tabs at the bottom of the view to switch to the Grid Data view of the new file. Click the mouse in the FIRST cell of the new spreadsheet (i.e., the Row 1, Orient 1 cell). Right-click and select Paste
 .
. - The data from the Example.dips8 file should now be pasted into the new file.
- Drag the mouse from row 41 to 100. Right-click and select Remove Row(s)
 to delete the remaining rows after row 40.
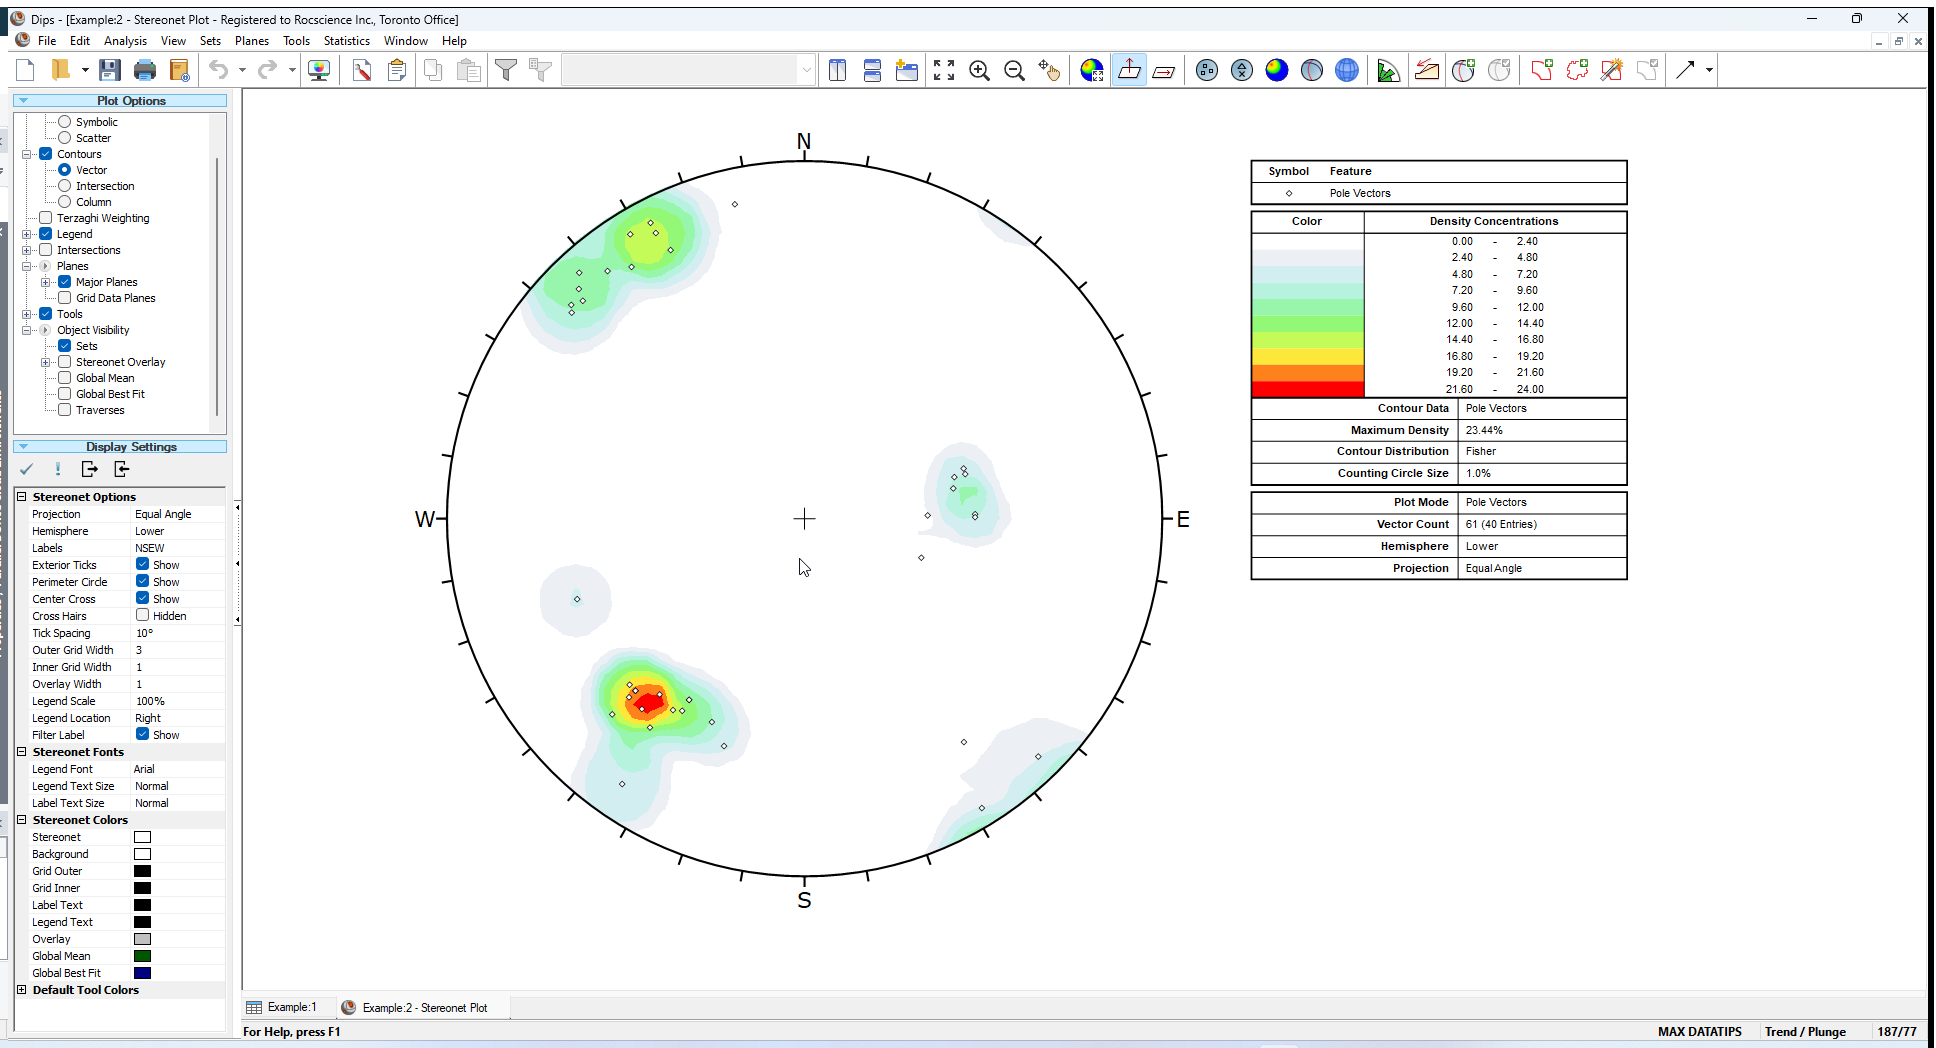
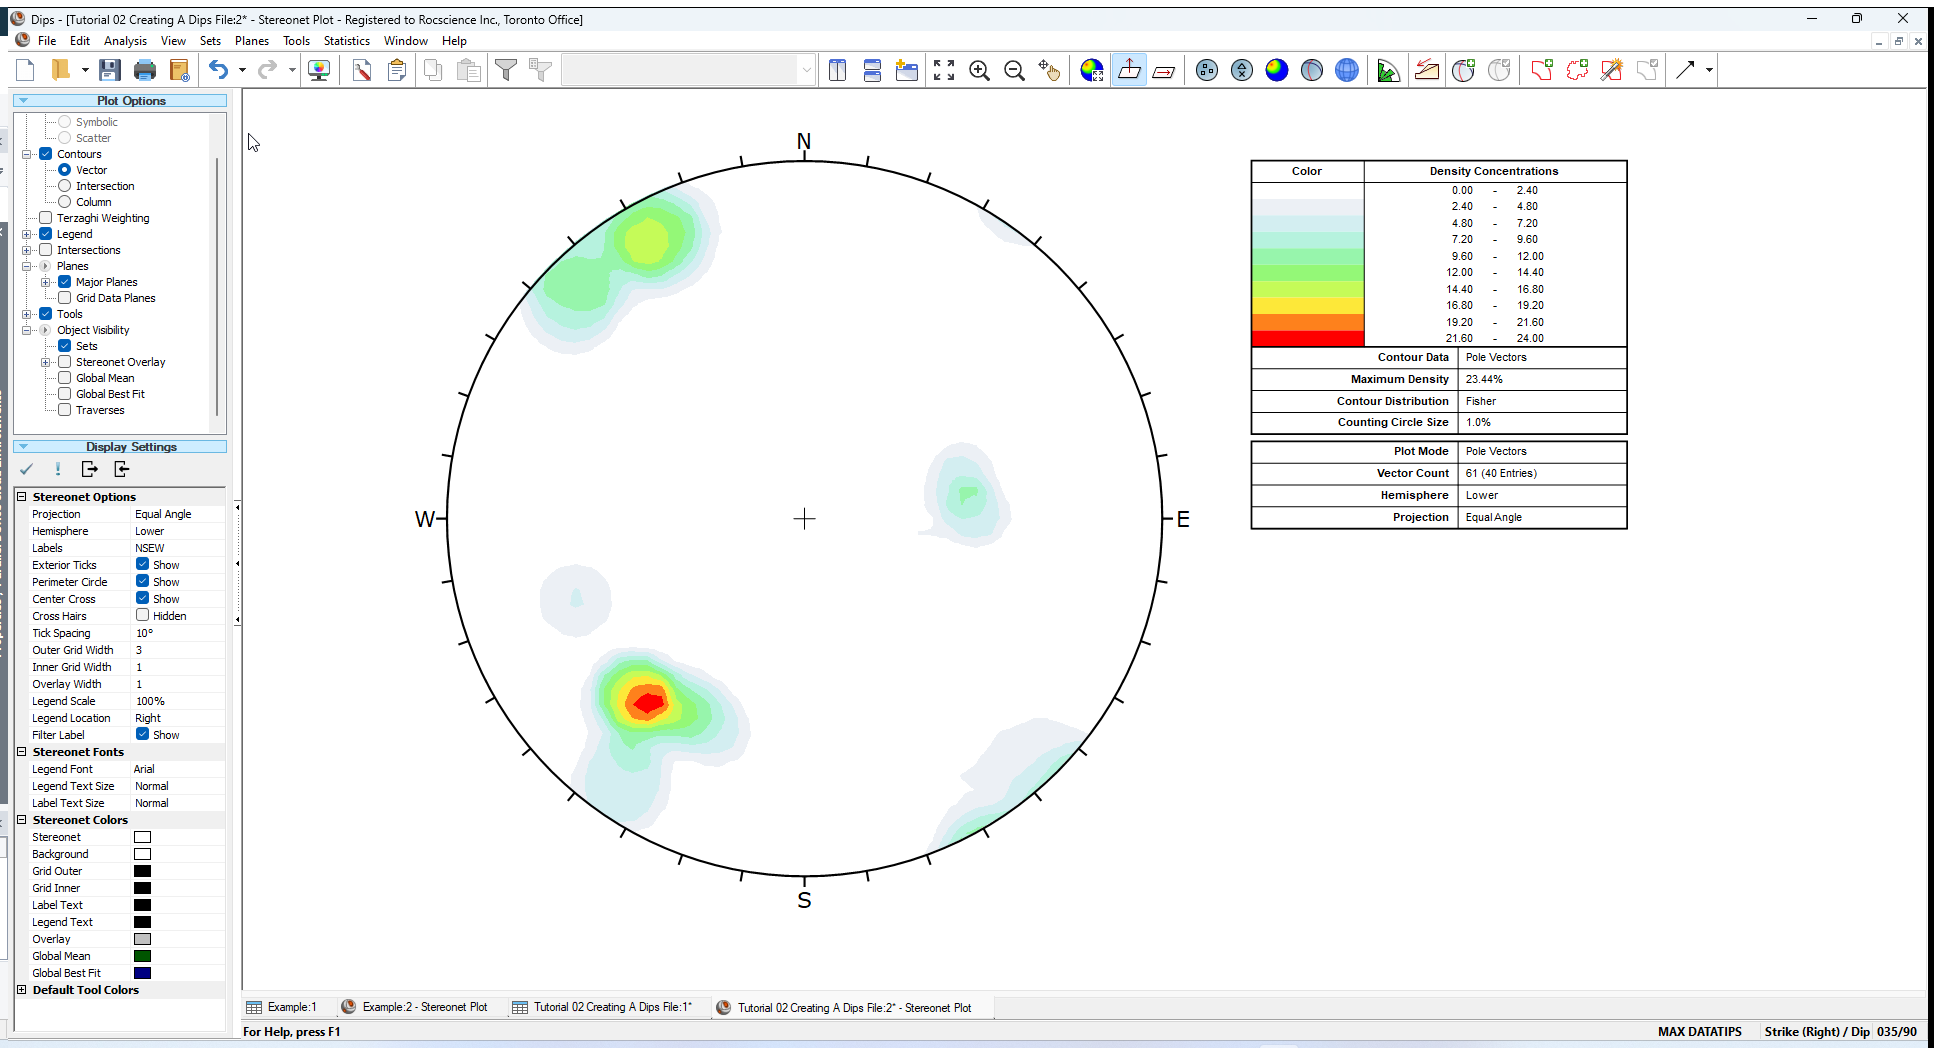
 - Select the Contour Plot
 toolbar button. Compare this to the contour plot of the original Example.dips8 file.
The plots should be identical for both files:- Maximum Density = 23.44%
- Vector Count = 61/40 entries
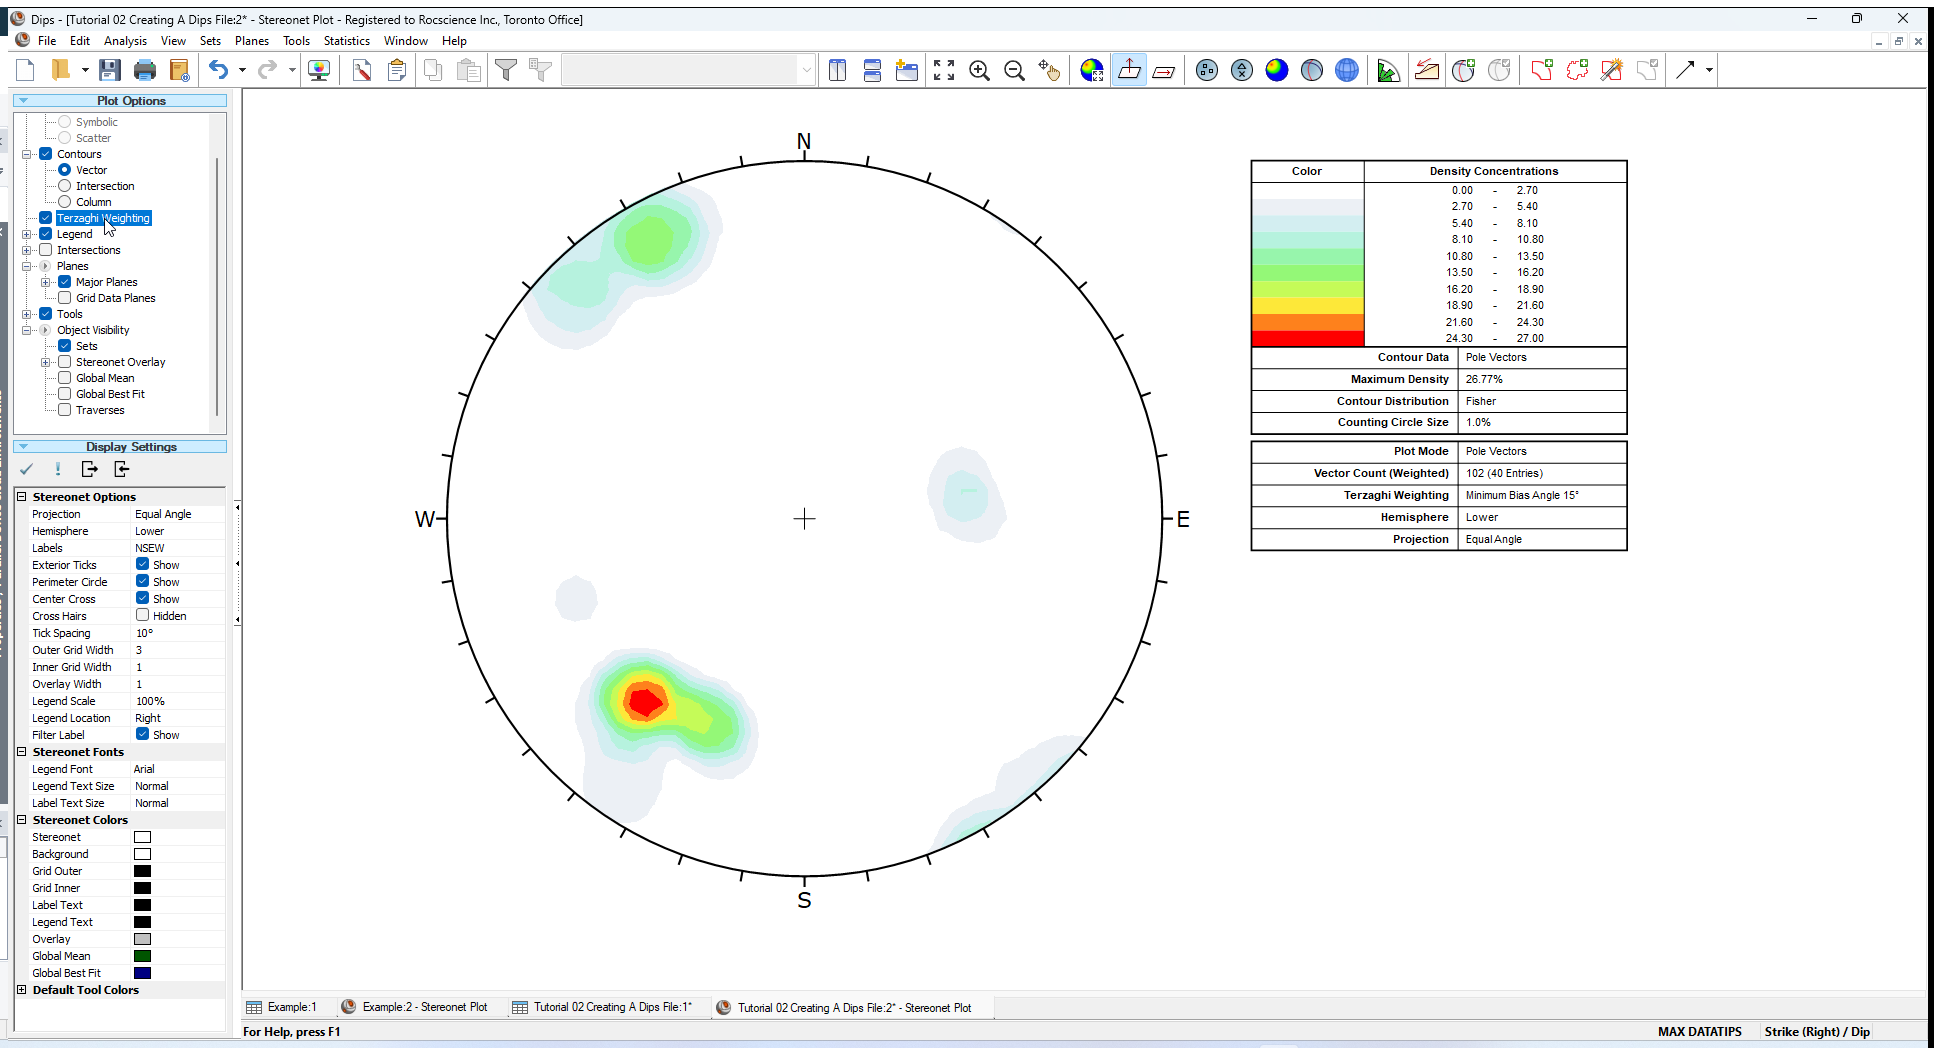
- Select the Terzaghi Weighting checkbox in the Sidebar for both contour plots, to view the weighted contours.
The plots should be identical for both files:- Maximum Density = 26.77%
- Vector Count = 102/40 entries
Let’s verify that we have correctly re-created the Example.dips8 file.
If the plots are not identical, examine the Project Settings and Traverse Information dialogs of the new file, and make sure they are the same as the Example.dips8 file. Also check that there are 40 rows of data in the new file, since the Example.dips8 file contains forty rows.
You may have noticed that we defined a Linear Borehole Traverse (in the Traverse Information dialog) but we did not actually enter any borehole data in the main Dips spreadsheet (i.e., Traverse ID = 3 is not used in the Traverse column, only ID numbers 1, 2 and 4 are used).
Oriented core borehole data is discussed in more detail in Tutorial 11 - Oriented Core and Rock Mass Classification.
That concludes the tutorial. You are now ready for the next tutorial Tutorial 03 - Sets (Add Set Window) in Dips.