3 - Set Window
1.0 Introduction
This tutorial covers the addition of Sets in DIPS. The Add Set Window method of creating Sets is discussed.
Topics Covered in this Tutorial:
- Add Set Window
- Weighted / Unweighted Planes
- Major Planes Plot
Finished Product:
The finished product of this tutorial can be found in the Tutorial 03 Sets (Set Window).dips8 file, located in the Examples > Tutorials folder in your DIPS installation folder.
2.0 Model
If you have not already done so, run DIPS by double-clicking on the DIPS icon in your installation folder. Or from the Start menu, select Programs > Rocscience > DIPS > DIPS.
If the DIPS application window is not already maximized, maximize it now, so that the full screen is available for viewing the model.
DIPS comes with several example files installed with the program. These example files can be accessed by selecting File > Recent Folders > Examples Folder from the DIPS main menu. This tutorial will use the Example.dips8 file to demonstrate the basic plotting features of DIPS.
- Select File > Recent Folders > Example Folder
 from the menu.
 - Open the Example.dips8 file. Since we will be using the Example.dips8 file in other tutorials, save this example file with a new file name without overwriting the original file.
- Select File > Save As
 from the menu.
 - Enter the file name Tutorial 03 Sets Tutorial (Set Window) and Save the file.
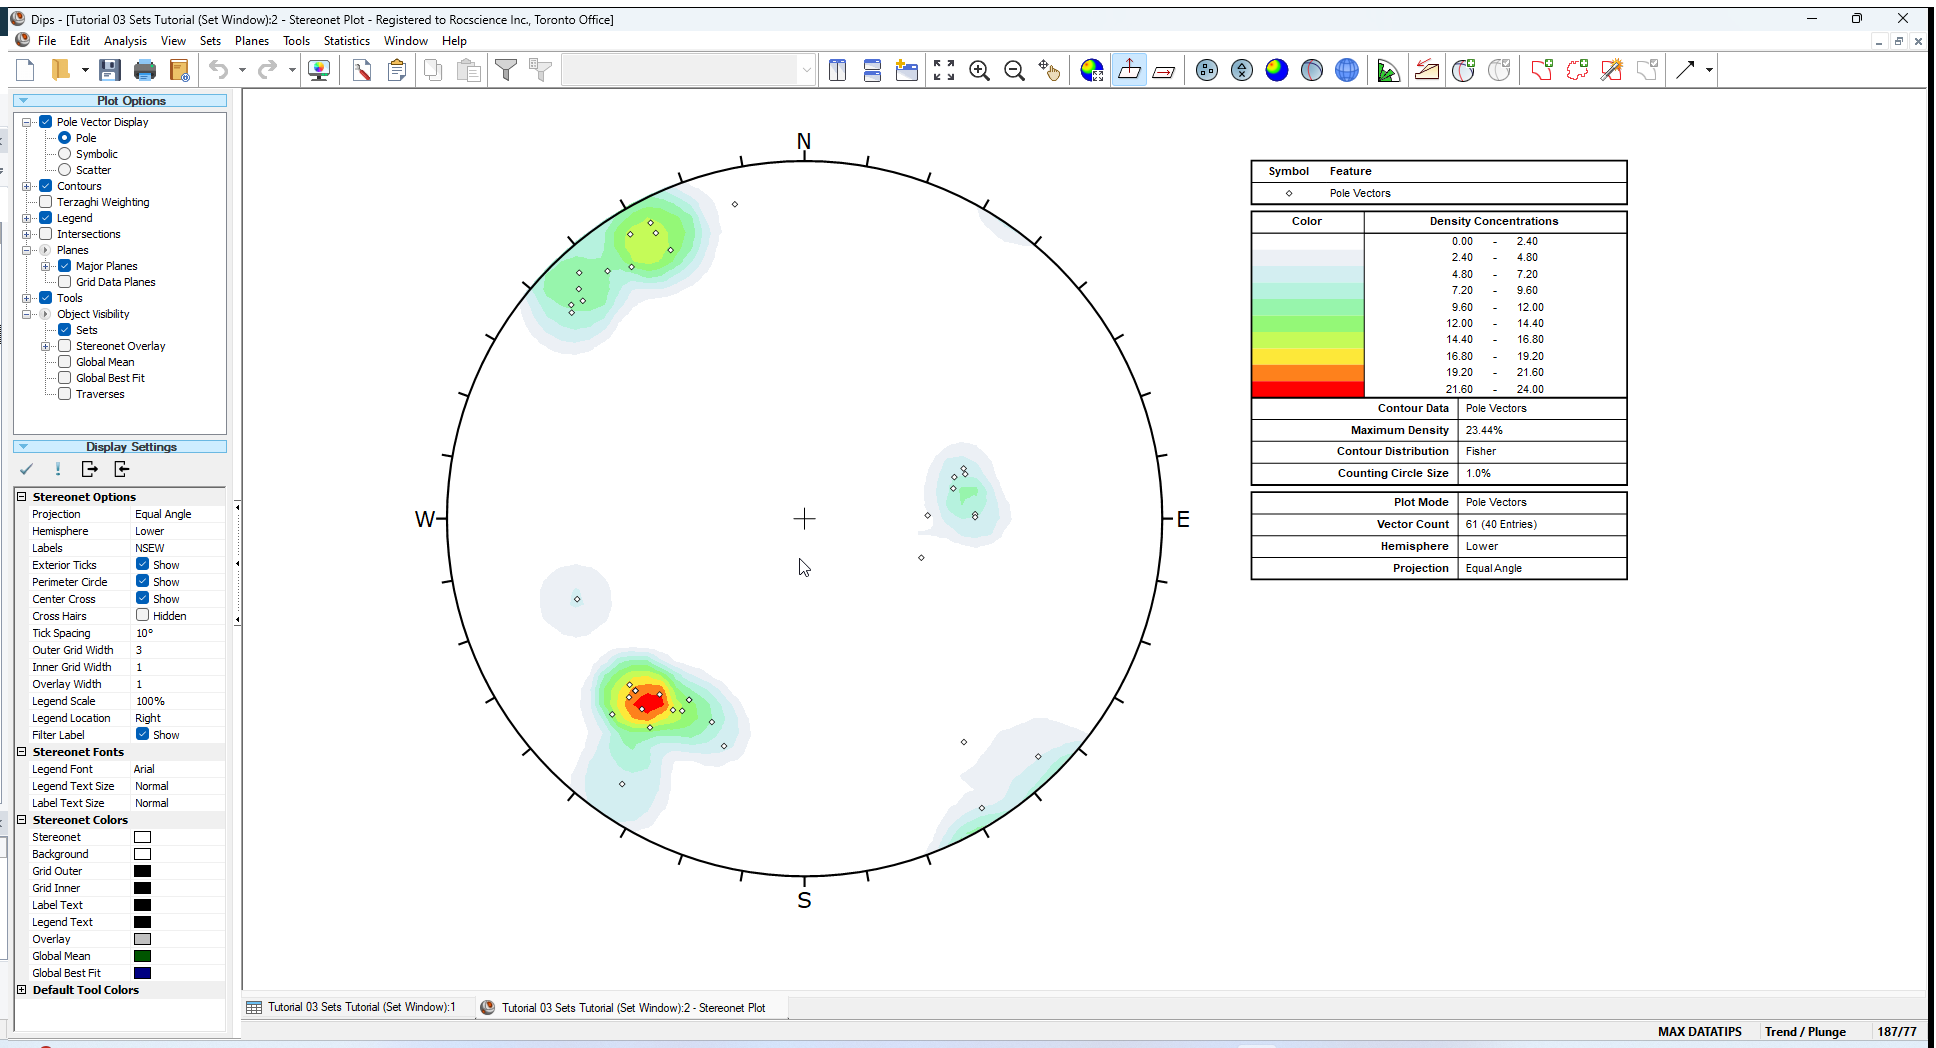
You should see the stereonet plot view shown in the following figure.
If you do not see the plot below, then use the Sidebar Plot Options to view pole vectors and contours on the Stereonet Plot View.
3.0 Adding Sets
A Set as defined in DIPS is a grouping of poles created with one of the following options in the Set menu:
- Add Set Window

- Add Set Freehand

- Add Set Circular
- Sets from Cluster Analysis

Sets are created for the purpose of obtaining Mean Set Plane orientations and Set Statistics of data clusters.
3.1 ADD SET WINDOW
We will demonstrate the Add Set Window option. The Add Set Window option allows you to draw windows around data clusters on the stereonet. The windows created with Add Set Window are curvilinear four-sided windows, defined by Trend and Plunge values at opposite corners.
Let’s create our first Set with the small data cluster at the right side of the stereonet.
- Select Add Set Window option from the toolbar or the Sets menu.
- Locate the cursor at approximately Trend/Plunge = 55 / 65, and click the left mouse button. Remember that the cursor coordinates are displayed in the Status Bar. If necessary, switch to Trend/Plunge format by clicking on the format name on the Status Bar.
- Move the mouse in a clockwise direction, and you will see a curvilinear, four-sided Set Window opening up.
- Locate the cursor to approximately Trend/Plunge = 115 / 20, and click the left mouse button.
- In the Add Set Window dialog, leave the default Set ID = 1.
- Edit the First Corner and Second Corner coordinates, if the window does not enclose the desired data.
- Leave the default Visibility settings.
- Select OK

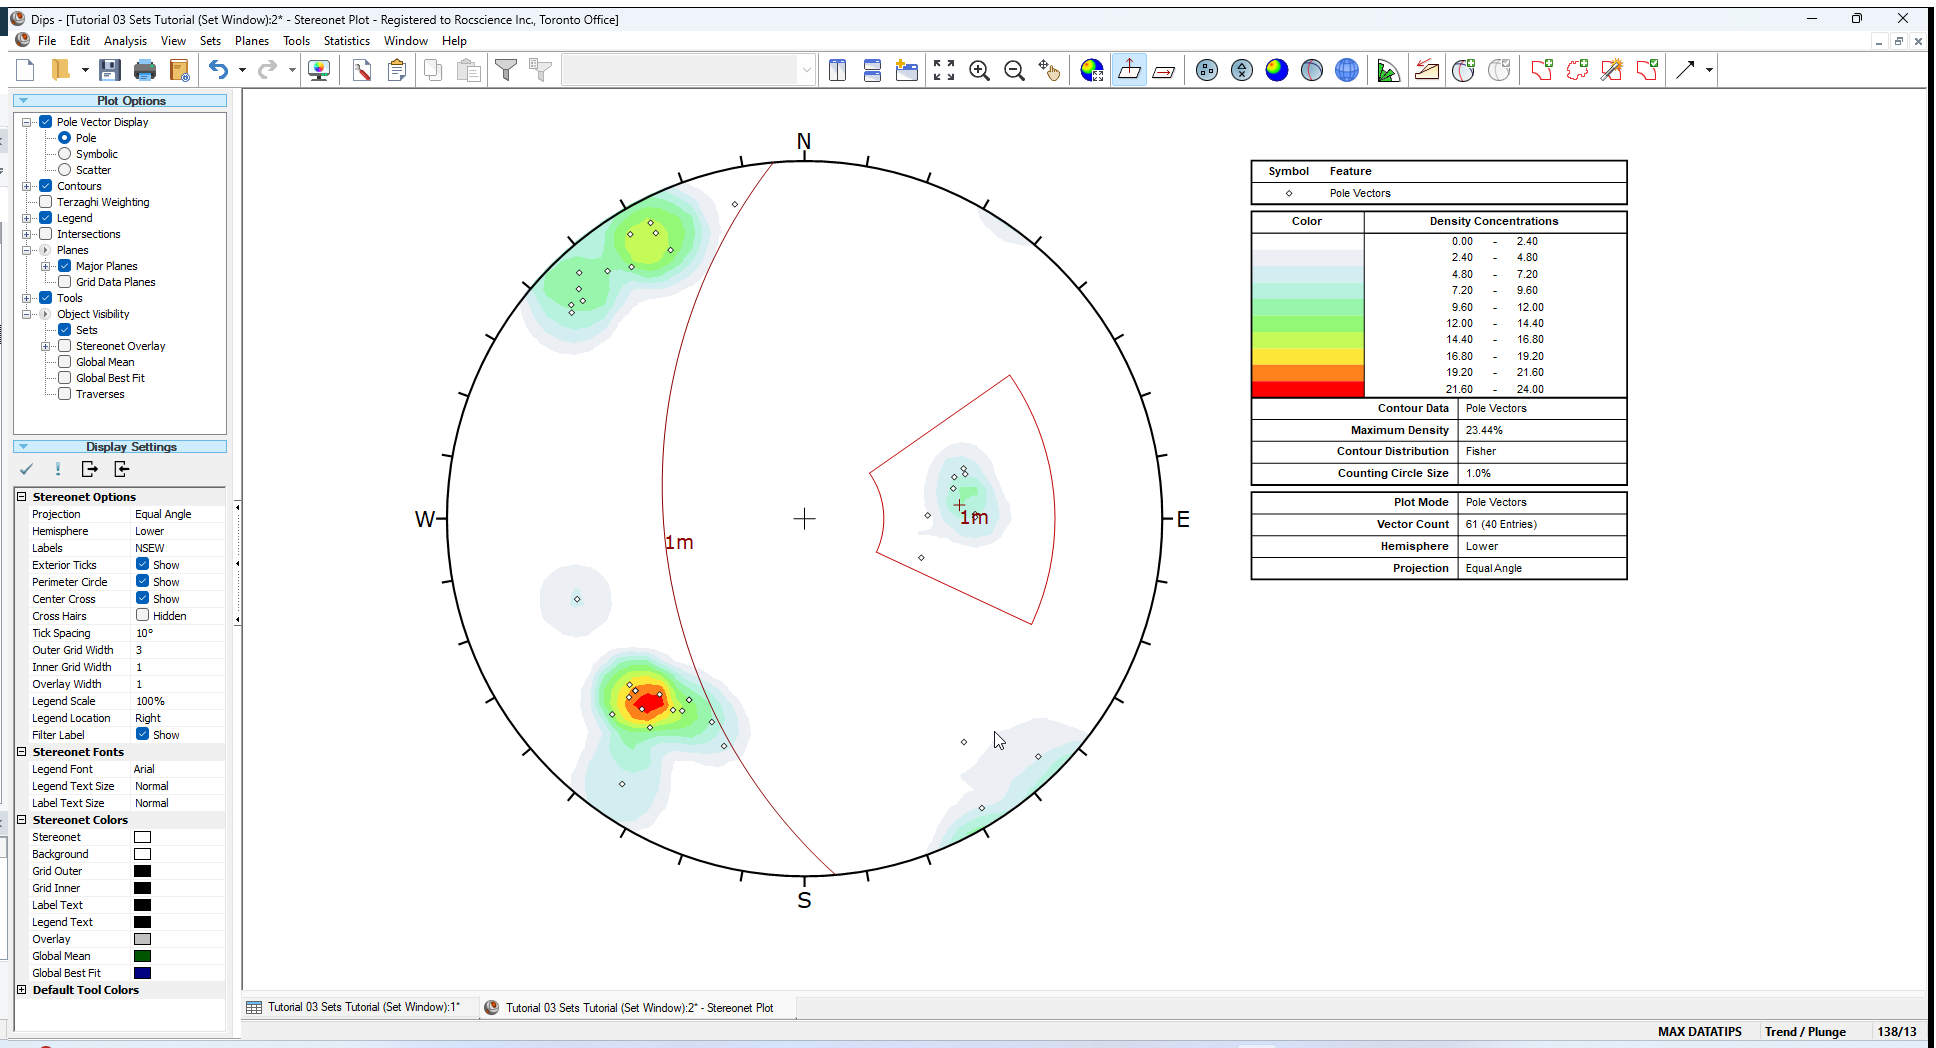
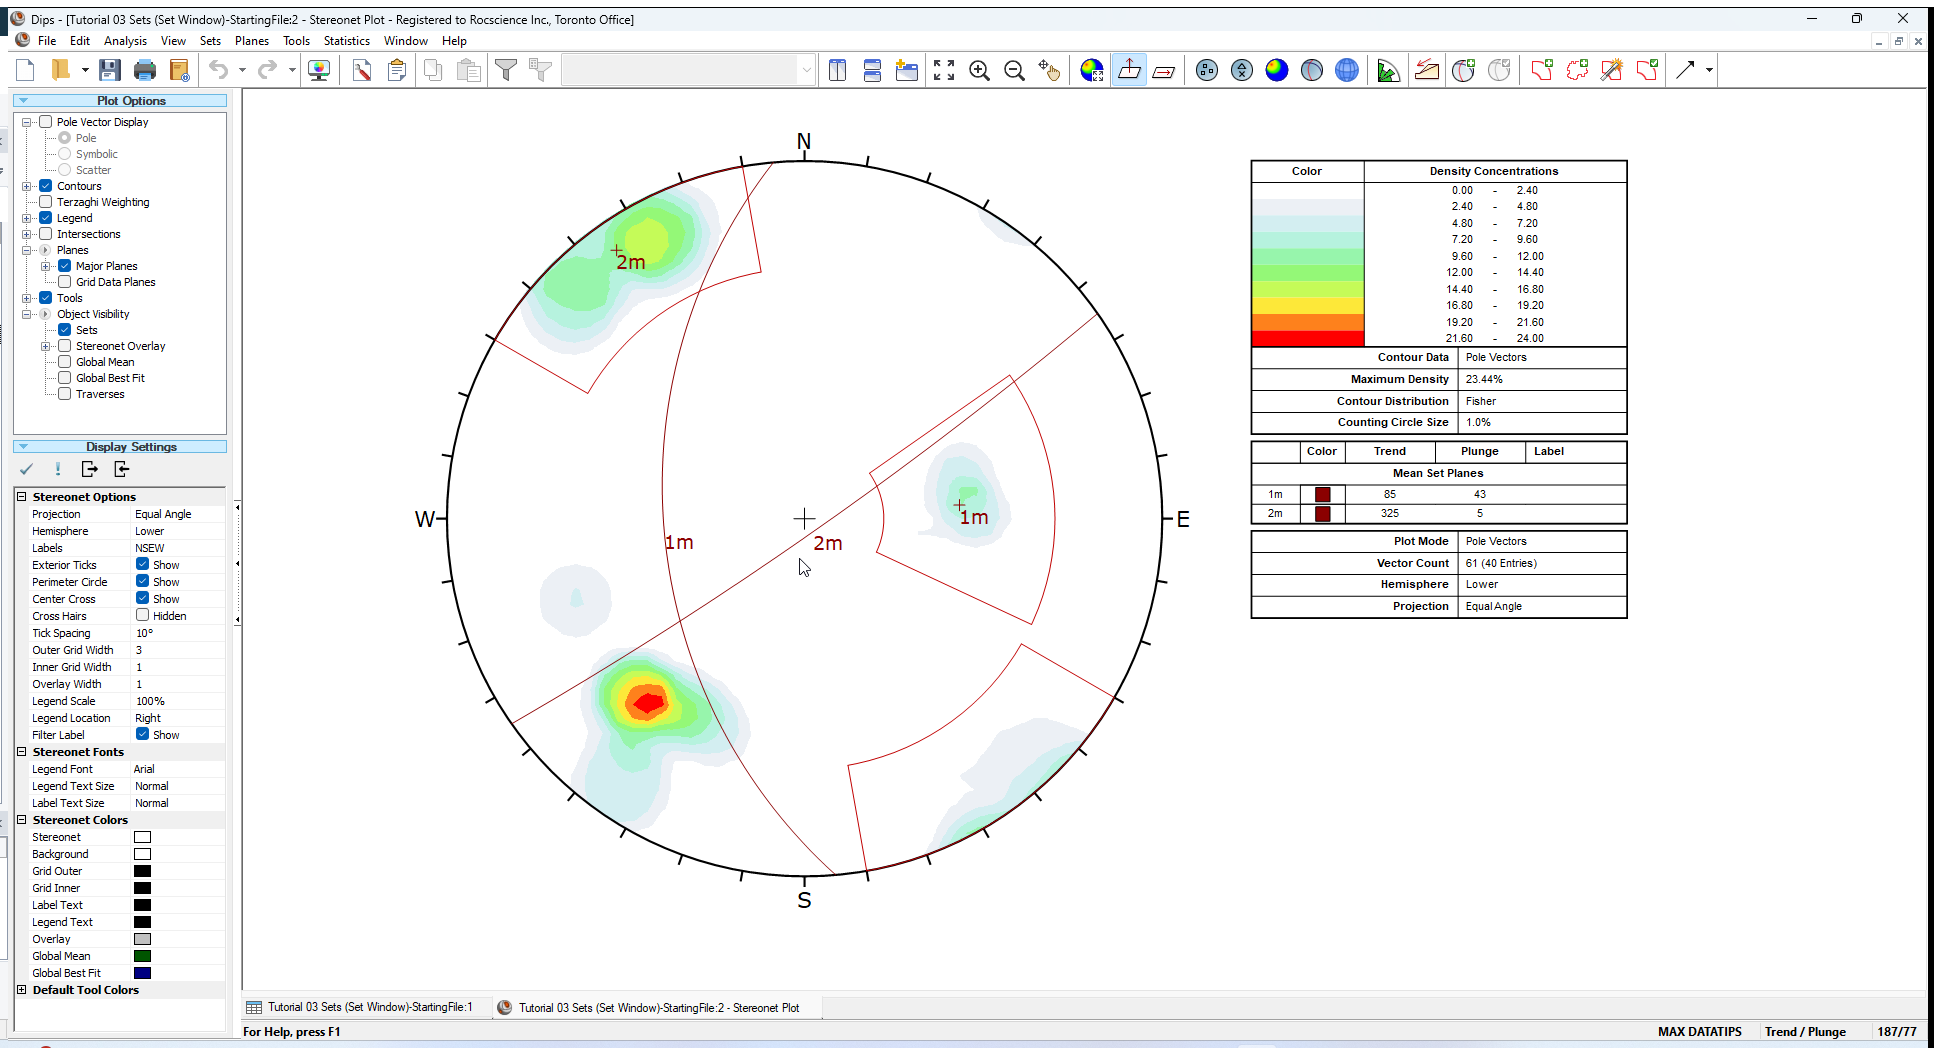
The Set will be created as shown below.
3.2 MEAN PLANE DISPLAY
When a Set is created, you will notice the following on the stereonet, as shown in the above figure:
- The Set Window is displayed.
- The Mean Set Plane is displayed according to the Visibility settings chosen in the Add Set Window dialog. In this case, we have displayed the Unweighted mean Pole vector and Plane.
- Unweighted mean poles / planes are identified by an “ m” beside the Set ID.
- Weighted mean poles / planes are identified by a “ w” beside the Set ID.
- The display of weighted or unweighted data is determined by the selection of the Terzaghi Weighting option in the Sidebar or View menu.
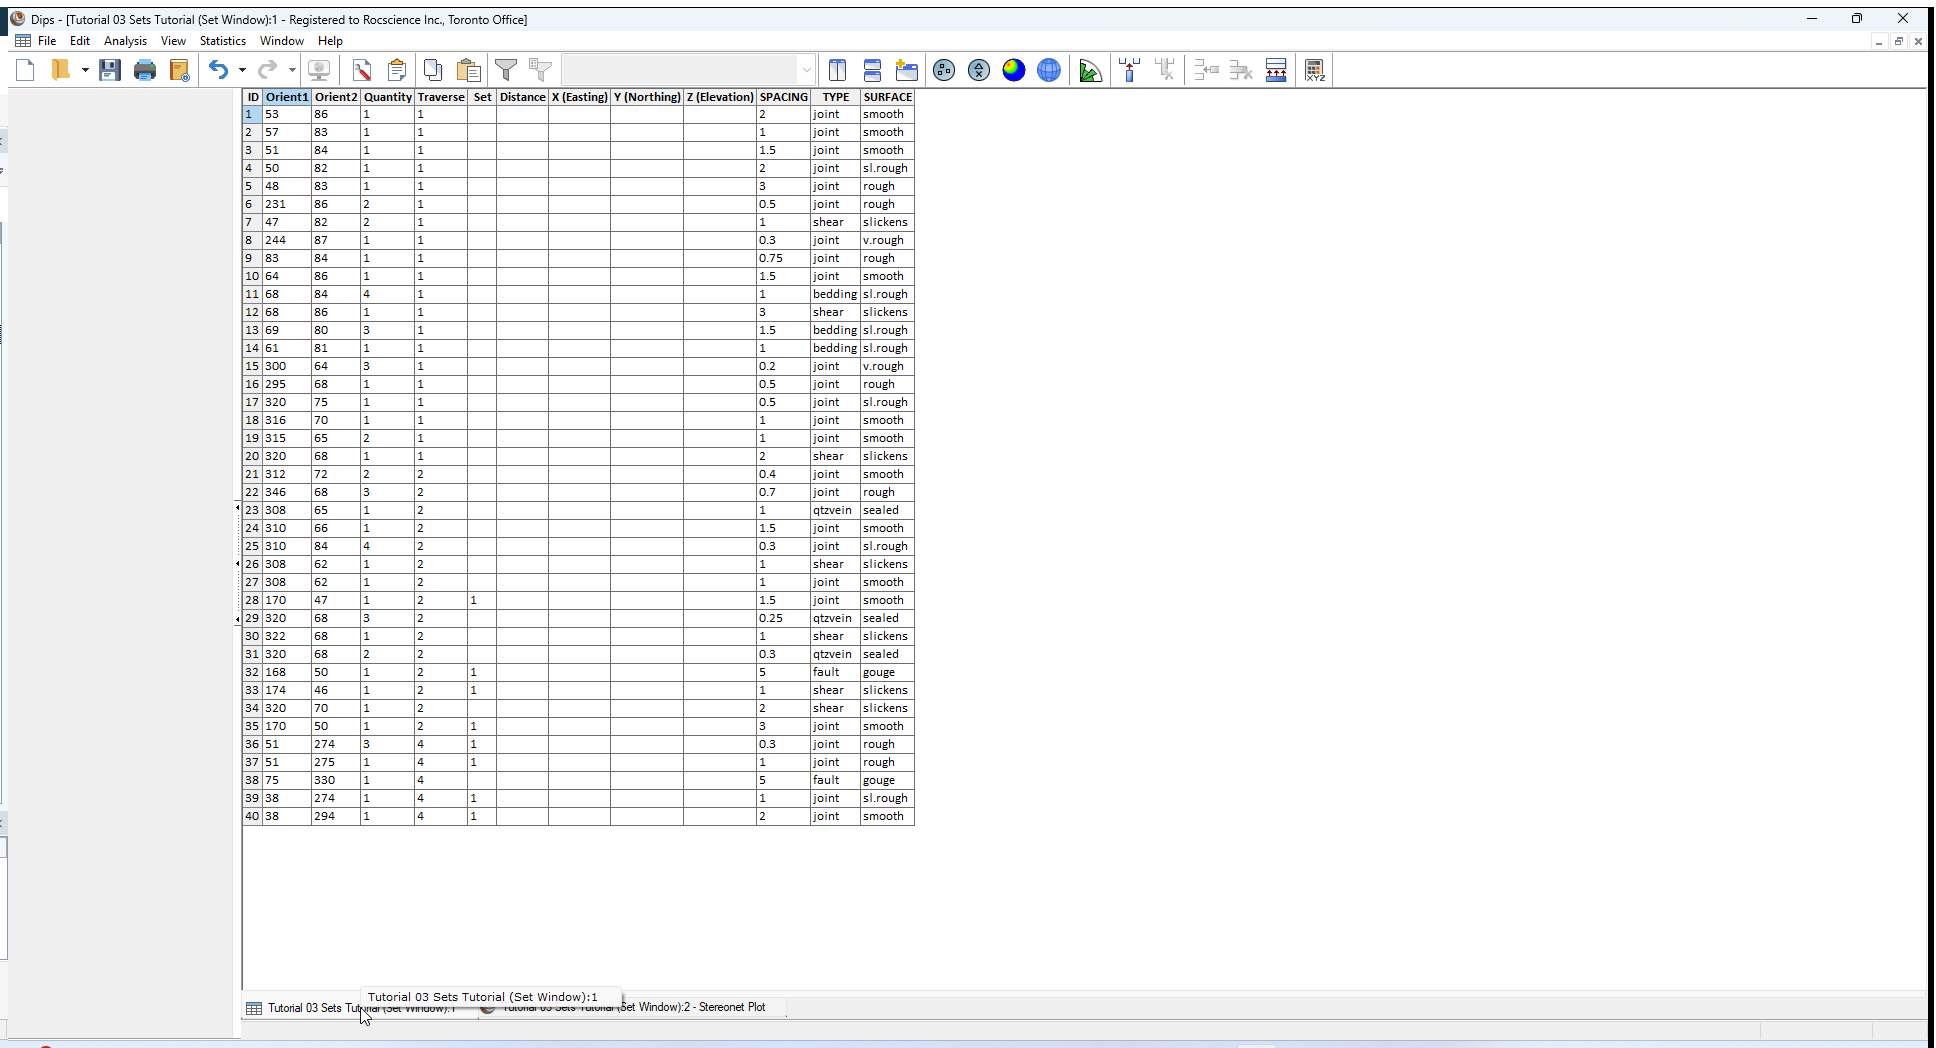
3.3 DATA TIP DISPLAY
If you hover the mouse over a set window a popup data tip will display the number of poles in the set.
![]()
For this example, the data tip for the set window should display:
- Set ID 1
- Poles 10
- Entries 8

The “8 entries” refers to the number of rows of the Grid Data within the Set. Since we have a Quantity column in this file, each row can represent multiple data units (poles). In this case, the 8 rows actually represent 10 poles.
3.4 SET COLUMN
When the first Set is created, a Set Column is automatically added to the Grid Data view. The Set column records the Set ID of data belonging to Sets.
Let’s verify this:
- Switch to the Grid Data view using the tabs at the lower left of the view.
- Notice the Set column, which appears AFTER the Traverse column.
- Notice the data in the Set column which is flagged with the Set ID = 1. These are the poles within the Set Window just created.
- Notice that 8 rows have Set ID = 1. This corresponds to the 8 entries listed in the data tip. The 10 poles is due to the fact that one pole (row 36) has Quantity = 3 (all others in the Set have Quantity = 1).
- Return to the Stereonet Plot View.
3.5 WRAPPED SET WINDOWS
We will create another Set, this time with a window which wraps around the perimeter of the stereonet.
After you have selected the FIRST corner of a Set Window with the Add Set Window option, you will notice that if the cursor moves beyond the stereonet perimeter, the window will “wrap around” and re-appear on the opposite side of the stereonet.
This allows data near the perimeter, on opposite sides of the stereonet, to be selected as one Set, as illustrated in the next figure.
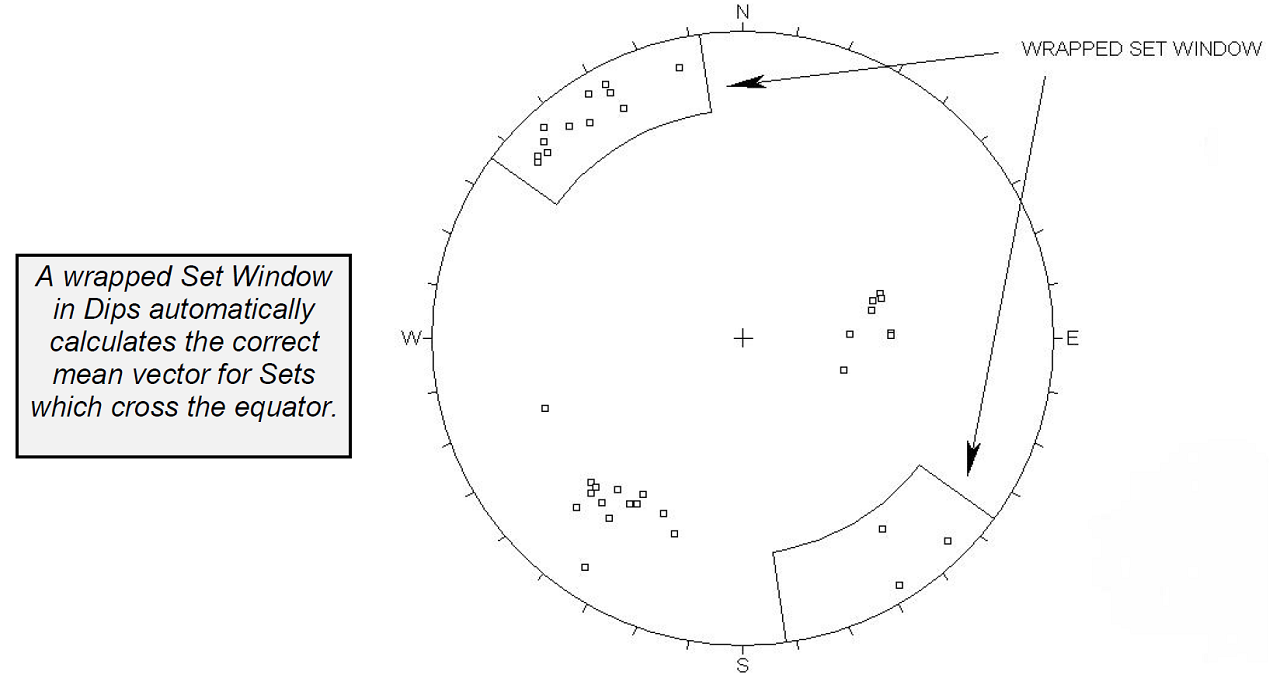
This useful feature of DIPS automatically calculates the correct mean vector for Sets with poles plotting on opposite sides of the equator, since a mean orientation calculated from the Lower Hemisphere alone will be incorrect!
The poles within a wrapped Set Window that plot on the opposite side of the stereonet, are incorporated into the vector addition as negative poles (i.e., plunge = -plunge , trend = trend +180), so that the mean will be correctly calculated.
Let’s create a second Set using a wrapped Set Window.
- Select Add Set Window option from the toolbar or the Sets menu.
- Locate the cursor at approximately Trend/Plunge = 300 / 20, and click the left mouse button. Remember that the cursor coordinates are displayed in the Status Bar.
- Move the cursor to the stereonet perimeter, and you will see that the Set Window reappears on the opposite side of the stereonet.
- Now move the cursor so that the Wrapped Set Window encloses the poles on the opposite side of the stereonet.
NOTE: You may have to Zoom Out and/or Pan
  the view in order to achieve this. A Wrapped Set Window may seem awkward at first, but is simple once you get the hang of it. At worst, if you are not happy with the starting point, right-click the mouse and select Cancel
  (or press Esc) and start again.
 - Click the left mouse button to enter the second window corner.
- In the Add Set Window dialog, leave the default Set ID = 2.
- Edit the First Corner and Second Corner coordinates, if the window does not enclose the desired data.
- Leave the default Visibility settings.
- Select OK.

If you zoomed or panned the view in step 4, select Zoom All  in the toolbar or press F2 to reset the view which should look as follows.
The Set Window and (unweighted) mean pole / plane are displayed. If you hover the mouse over Set 2 the data tip should indicate 22 poles and 15 entries (if you selected all of the poles on both sides of the stereonet).
Finally, note that the Set Column in the Grid Data view is updated to record the data in both Sets 1 and 2. Note that data which does not currently belong to any Set has a BLANK entry in the Set column.
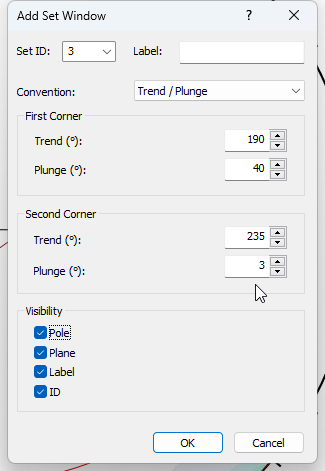
Now create a third Set Window around the remaining data concentration on the Contour Plot.
- Select Add Set Window option from the toolbar or the Sets menu.
- Locate the cursor at approximately Trend/Plunge = 190 / 40, and click the left mouse button.
- Locate the cursor at approximately Trend/Plunge = 235 / 3, and click the left mouse button.
- In the Add Set Window dialog, leave the default Set ID = 3.
- Edit the First Corner and Second Corner coordinates, if the window does not enclose the desired data.
- Leave the default Visibility settings.
- Select OK.
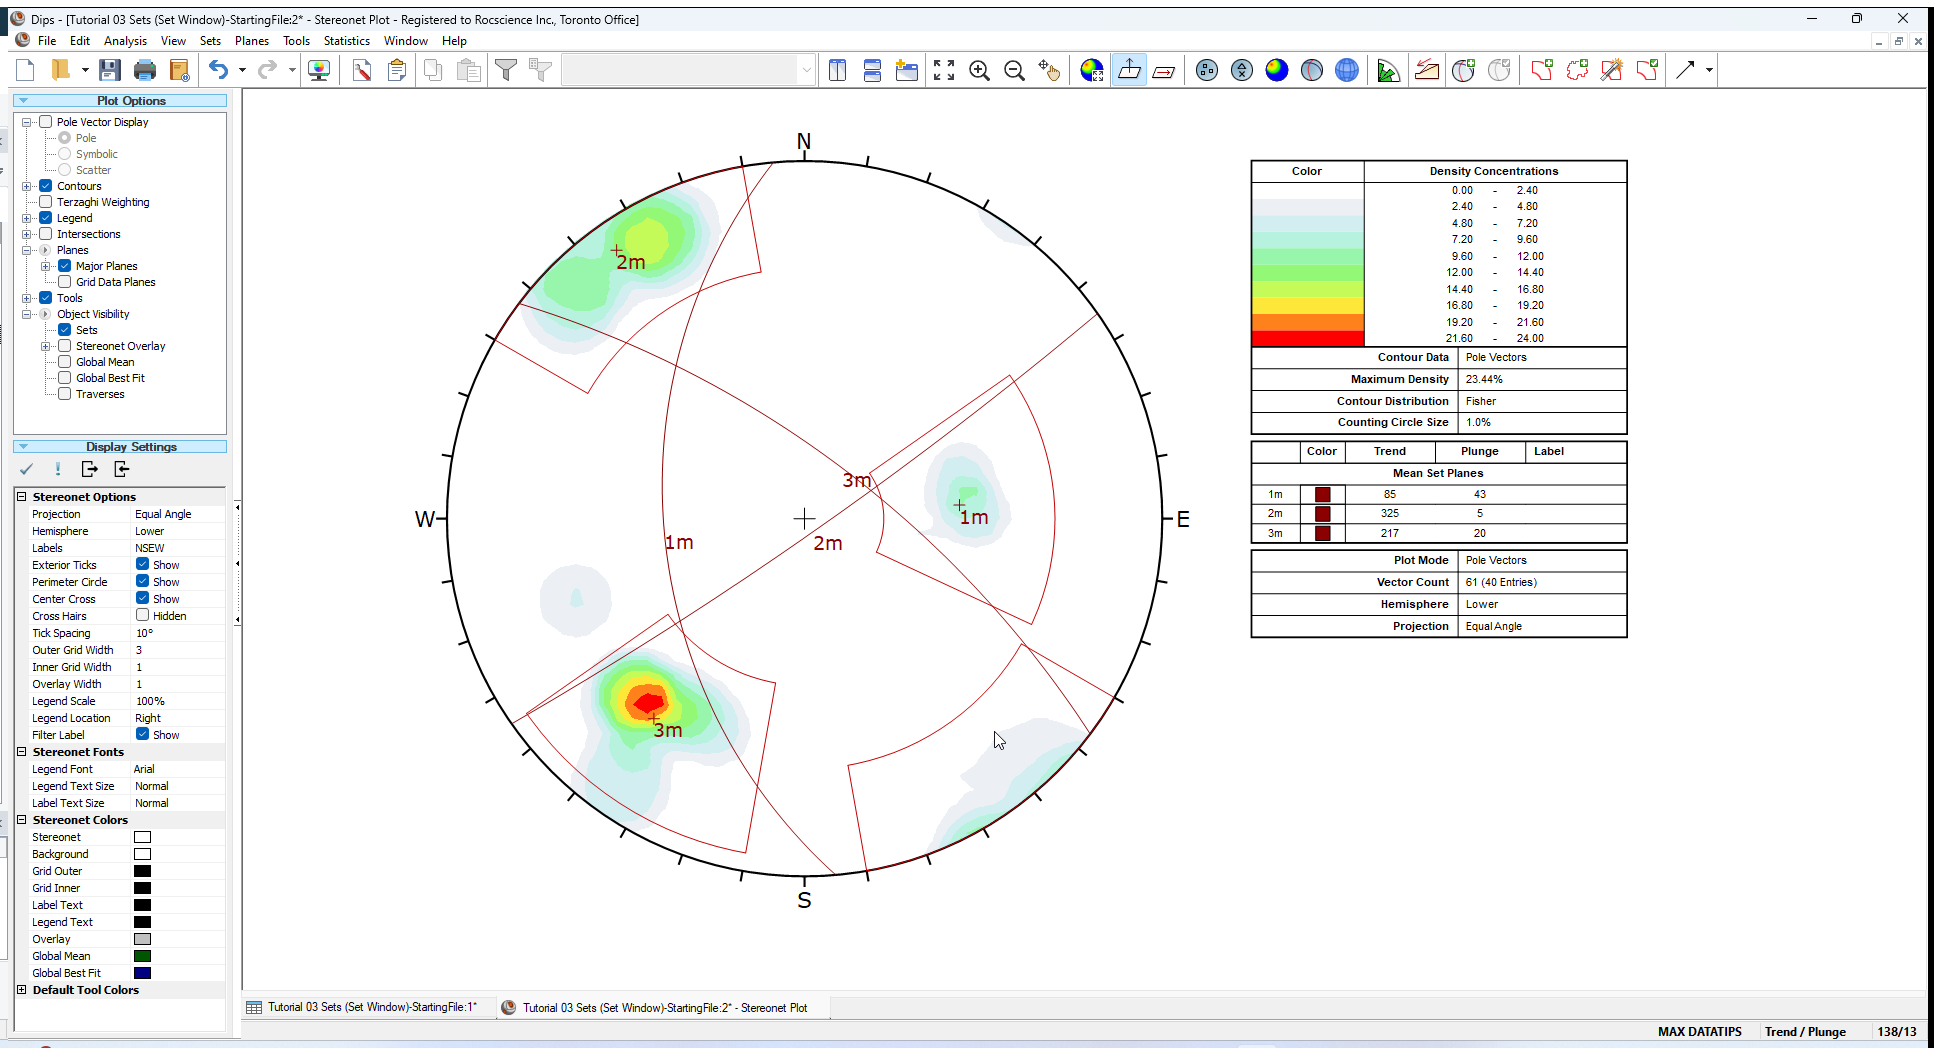
All three Sets will appear on the stereonet as shown below.
4.0 Set Information
Let’s look at the Info Viewer option, which provides a summary of your DIPS file as well as a listing of all Set information and other data.
- Select Info Viewer
 option from the toolbar or the Analysis menu.
 - As you scroll through the Info Viewer, you will see:
- Your DIPS file setup information under General Settings
- Traverses in the file.
- Global Mean orientation (i.e., the mean vector of all poles in the file) and Global Best Fit statistics
- If Sets have been created, you will then see:
- A listing of unweighted and weighted Mean Set Planes orientations for each Set, in the format corresponding to the current Convention, i.e. Pole Vector (Trend / Plunge) or Plane Vector format (Dip/Dip Direction or Strike/Dip).
- A listing of Set Statistics
- Fisher's K
- Confidence Limit and Variability Limit, at one, two and three standard deviations
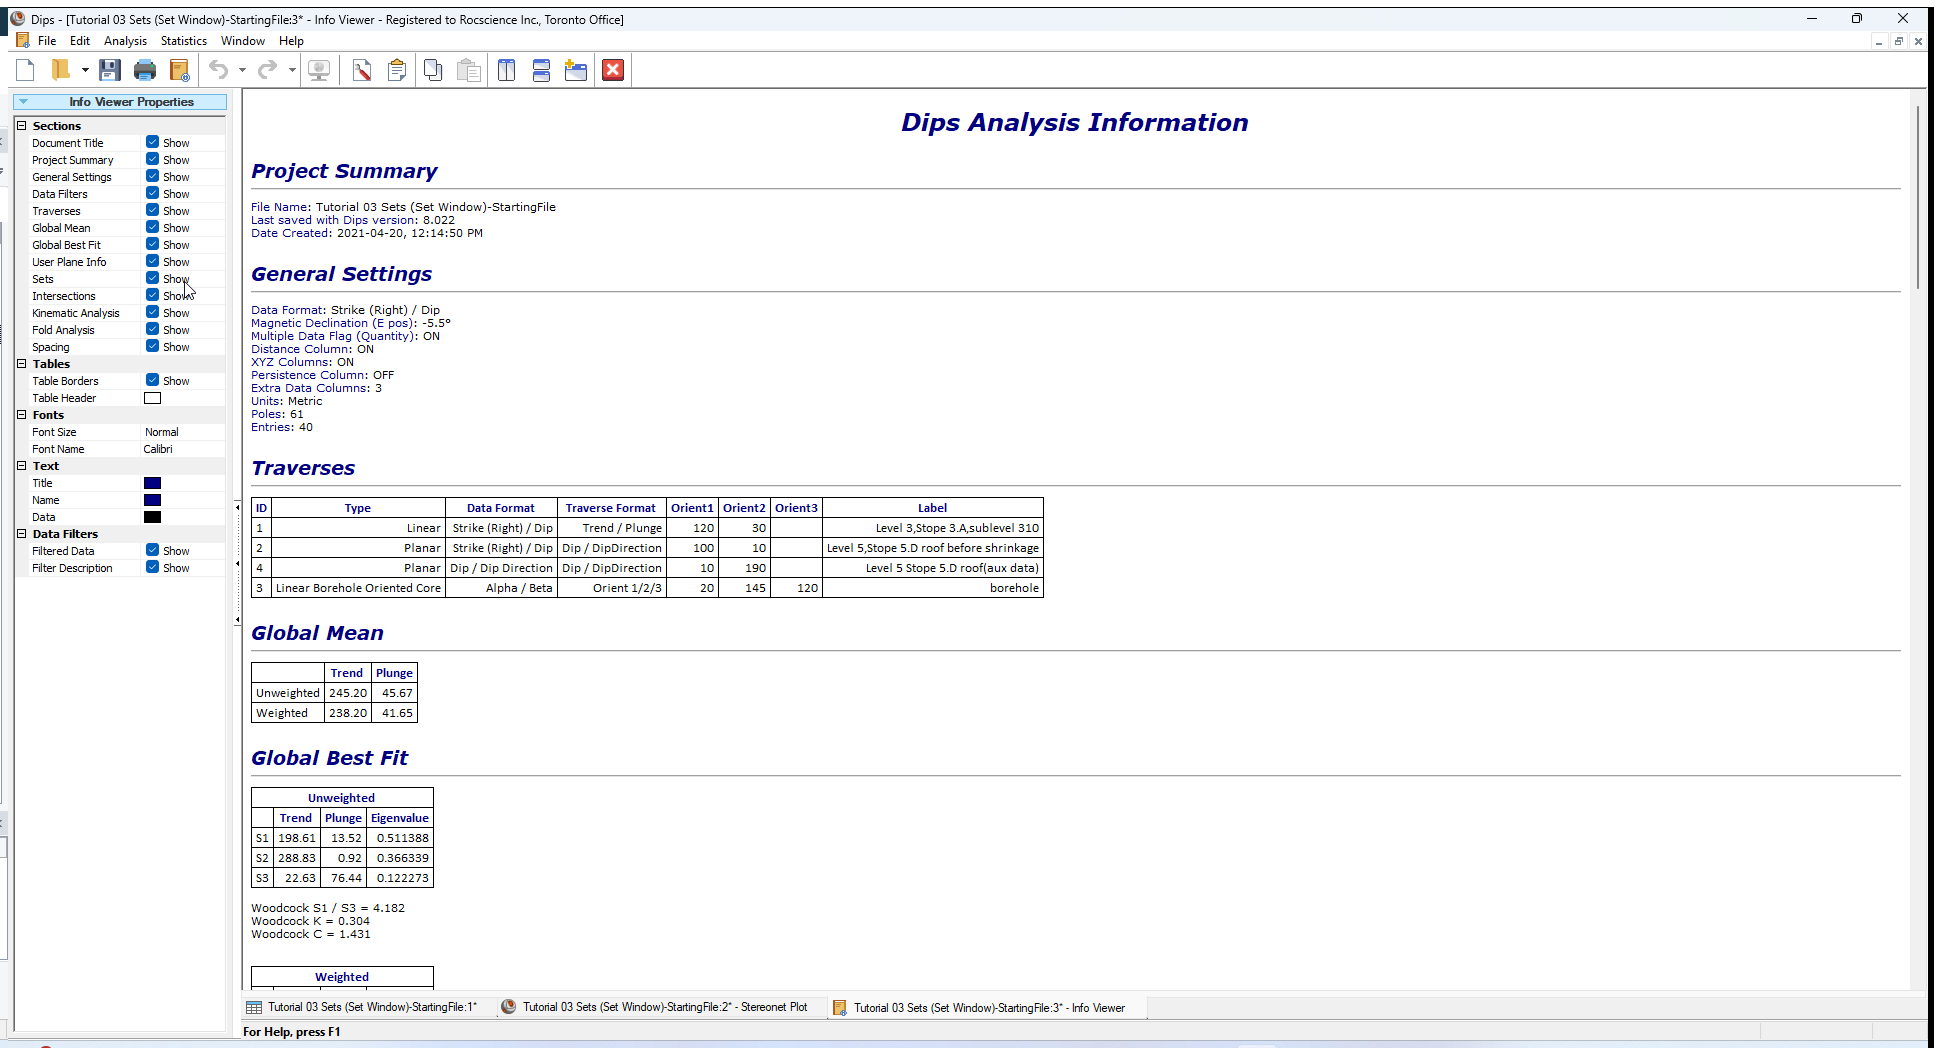
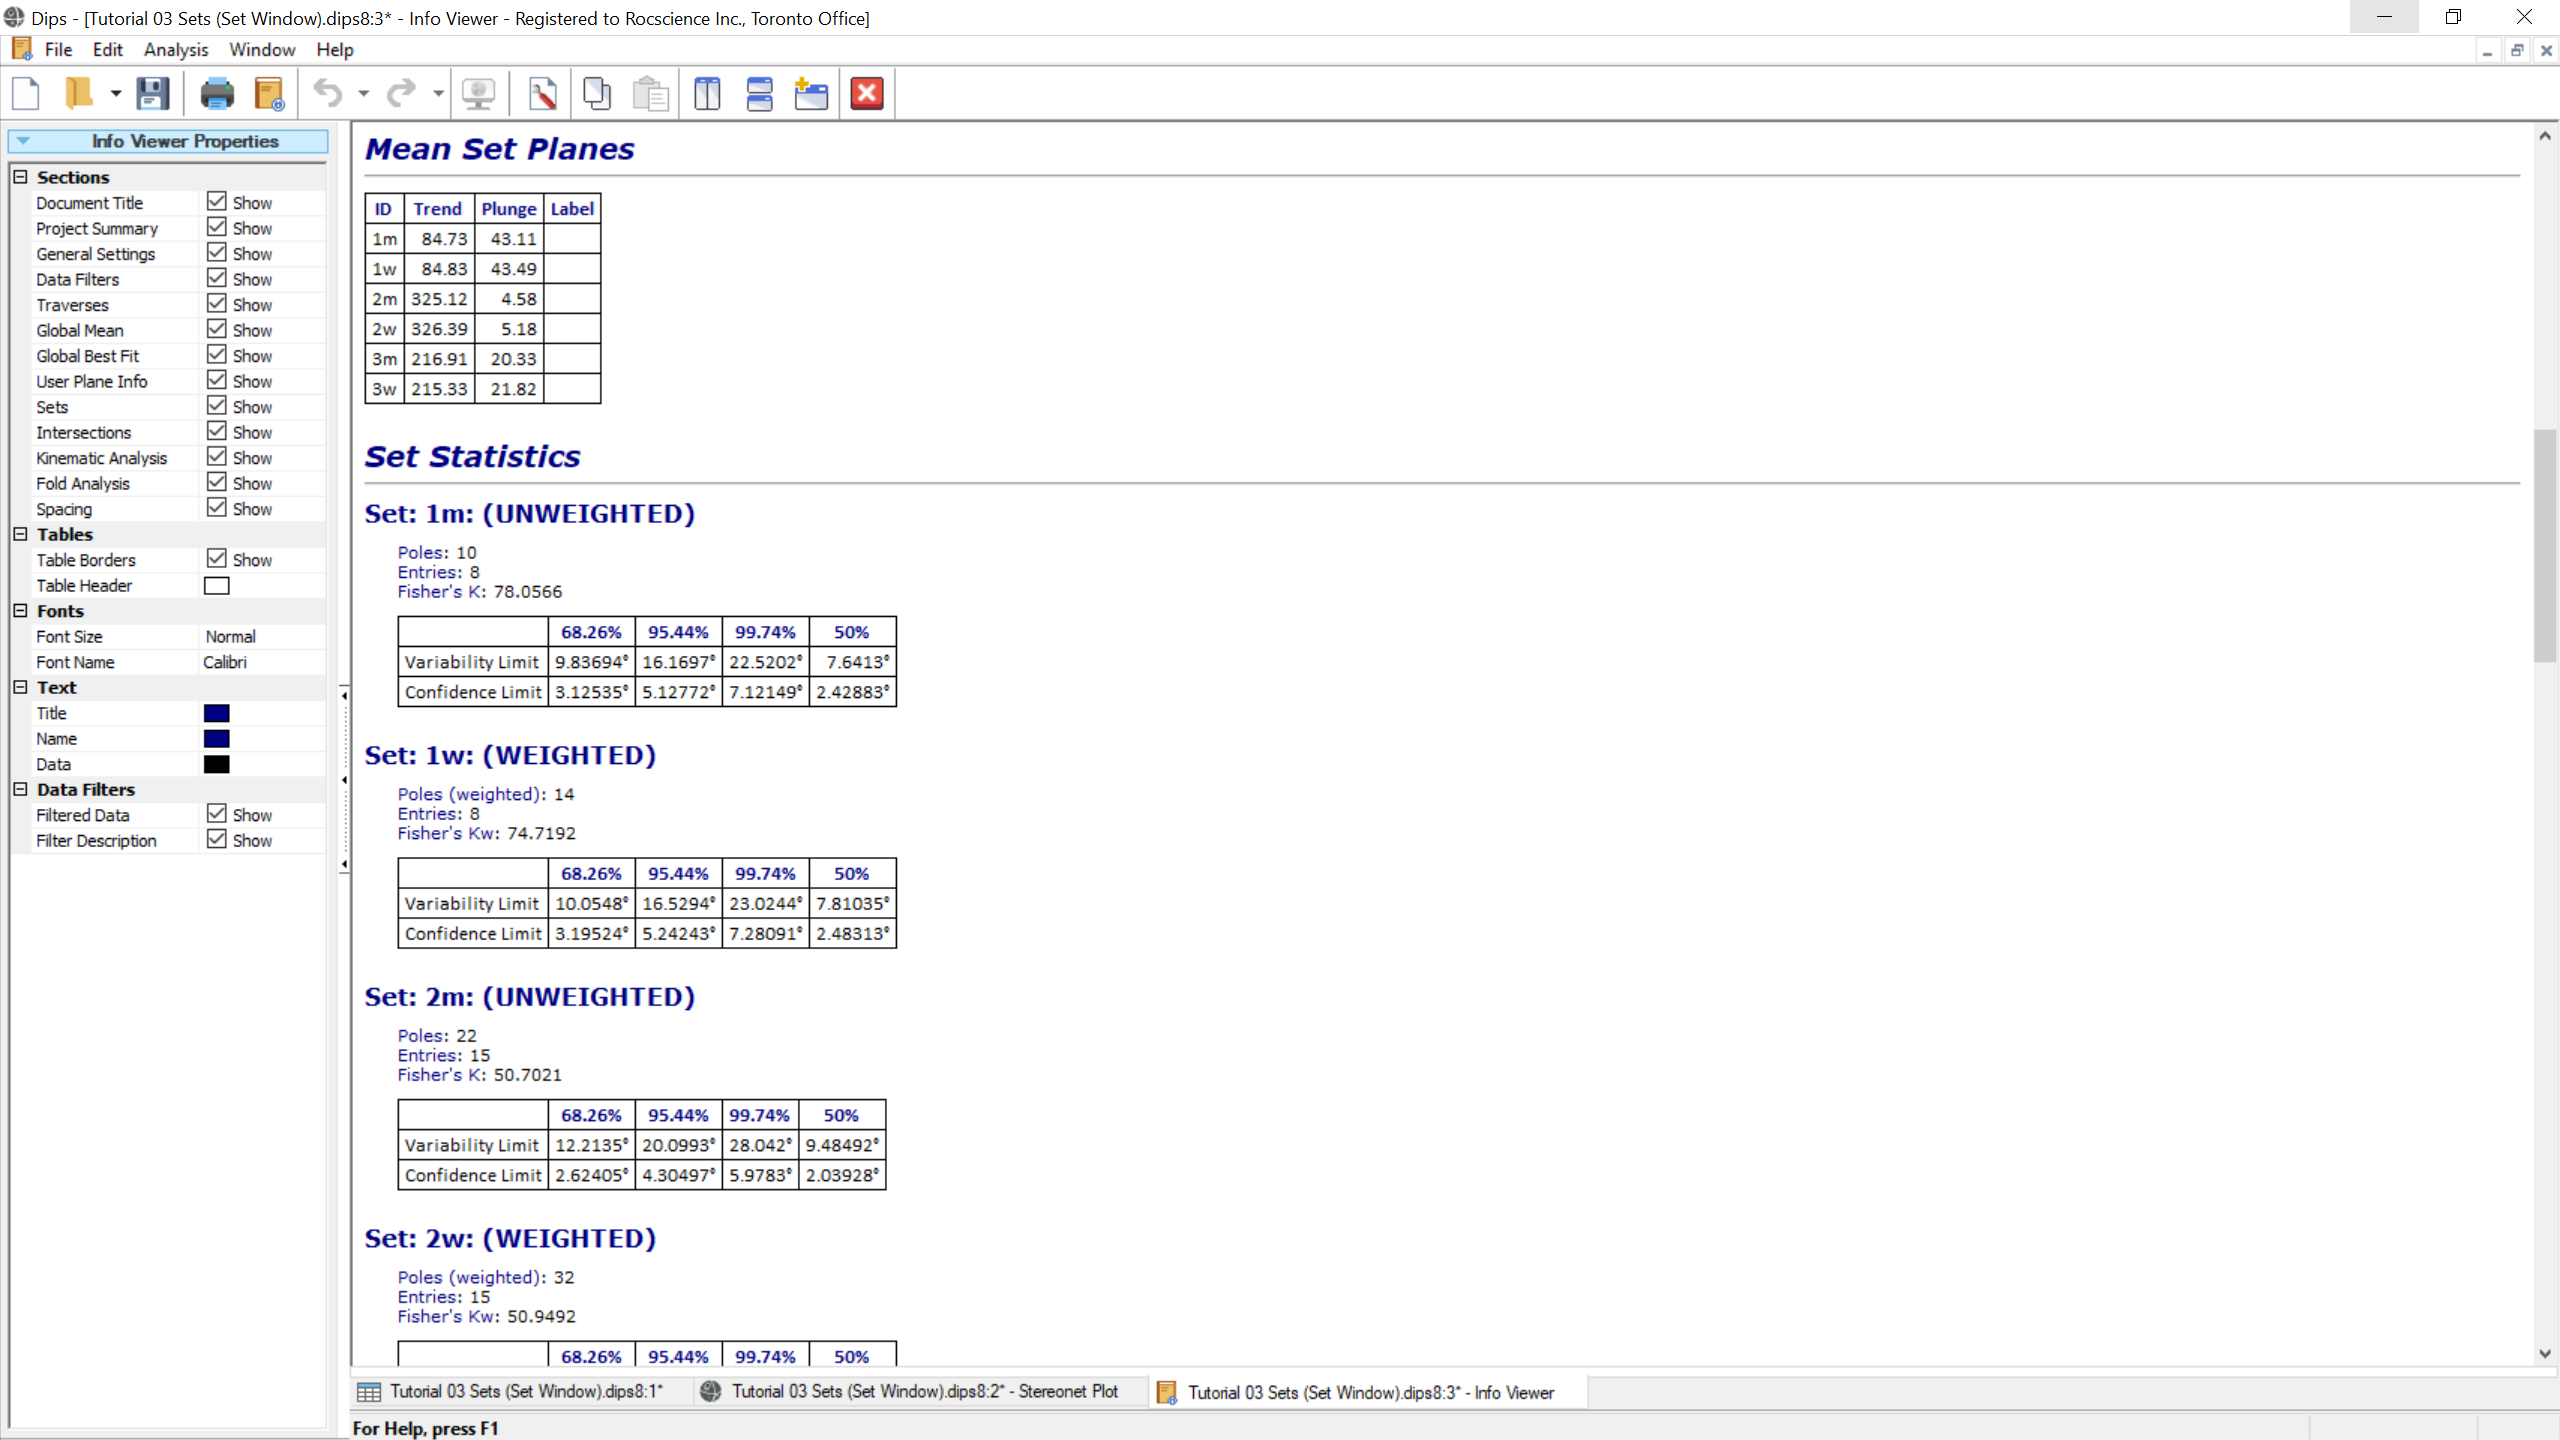
The Info Viewer listing can be printed, copied to the clipboard, etc. The Info Viewer behaves like any other view in DIPS (i.e., it can be tiled, minimized, maximized, etc.), and is automatically updated whenever new information is added to the current document (e.g., when a new Set is created).
When you are finished examining the Info Viewer, close the view:
- Select the Close
 button in the upper right corner in the toolbar.
5.0 Major Planes Plot
The Major Planes Plot option in DIPS allows you to view Planes and Set Windows only on a clean stereonet, without poles or contours. In addition, a listing of plane orientations is displayed in the legend, in the format governed by the current Convention (Trend / Plunge or Plane Vector).
To view only Major Planes on the stereonet:
- Select Major Planes
 option from the toolbar or View menu.
The following planes are displayed on a Major Planes Plot:
- All Added User Planes created with the Add User Plane option, and
- All Mean Set Planes and Set Windows created with the Add Set Window option (or other set options)
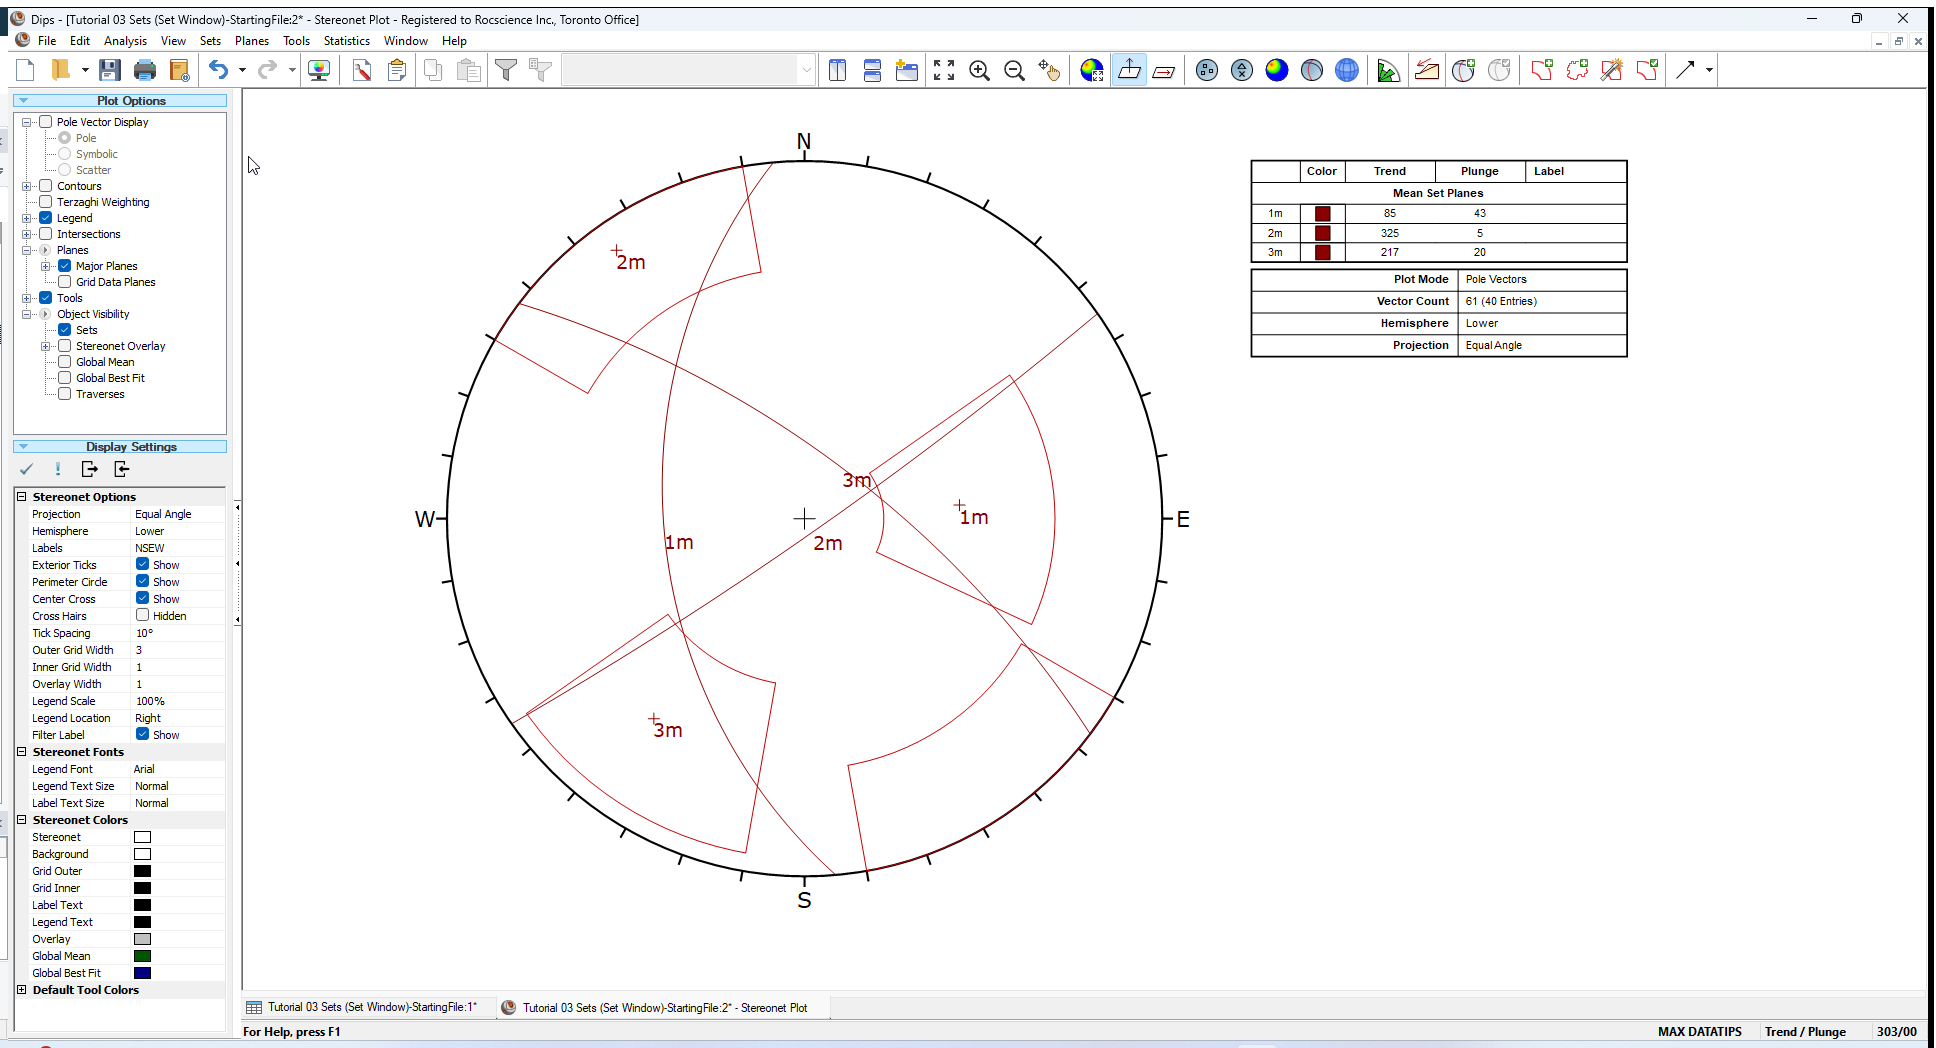
Only planes / poles toggled for Visibility in the Edit User Planes and Edit Sets dialogs are displayed on the Major Planes Plot.
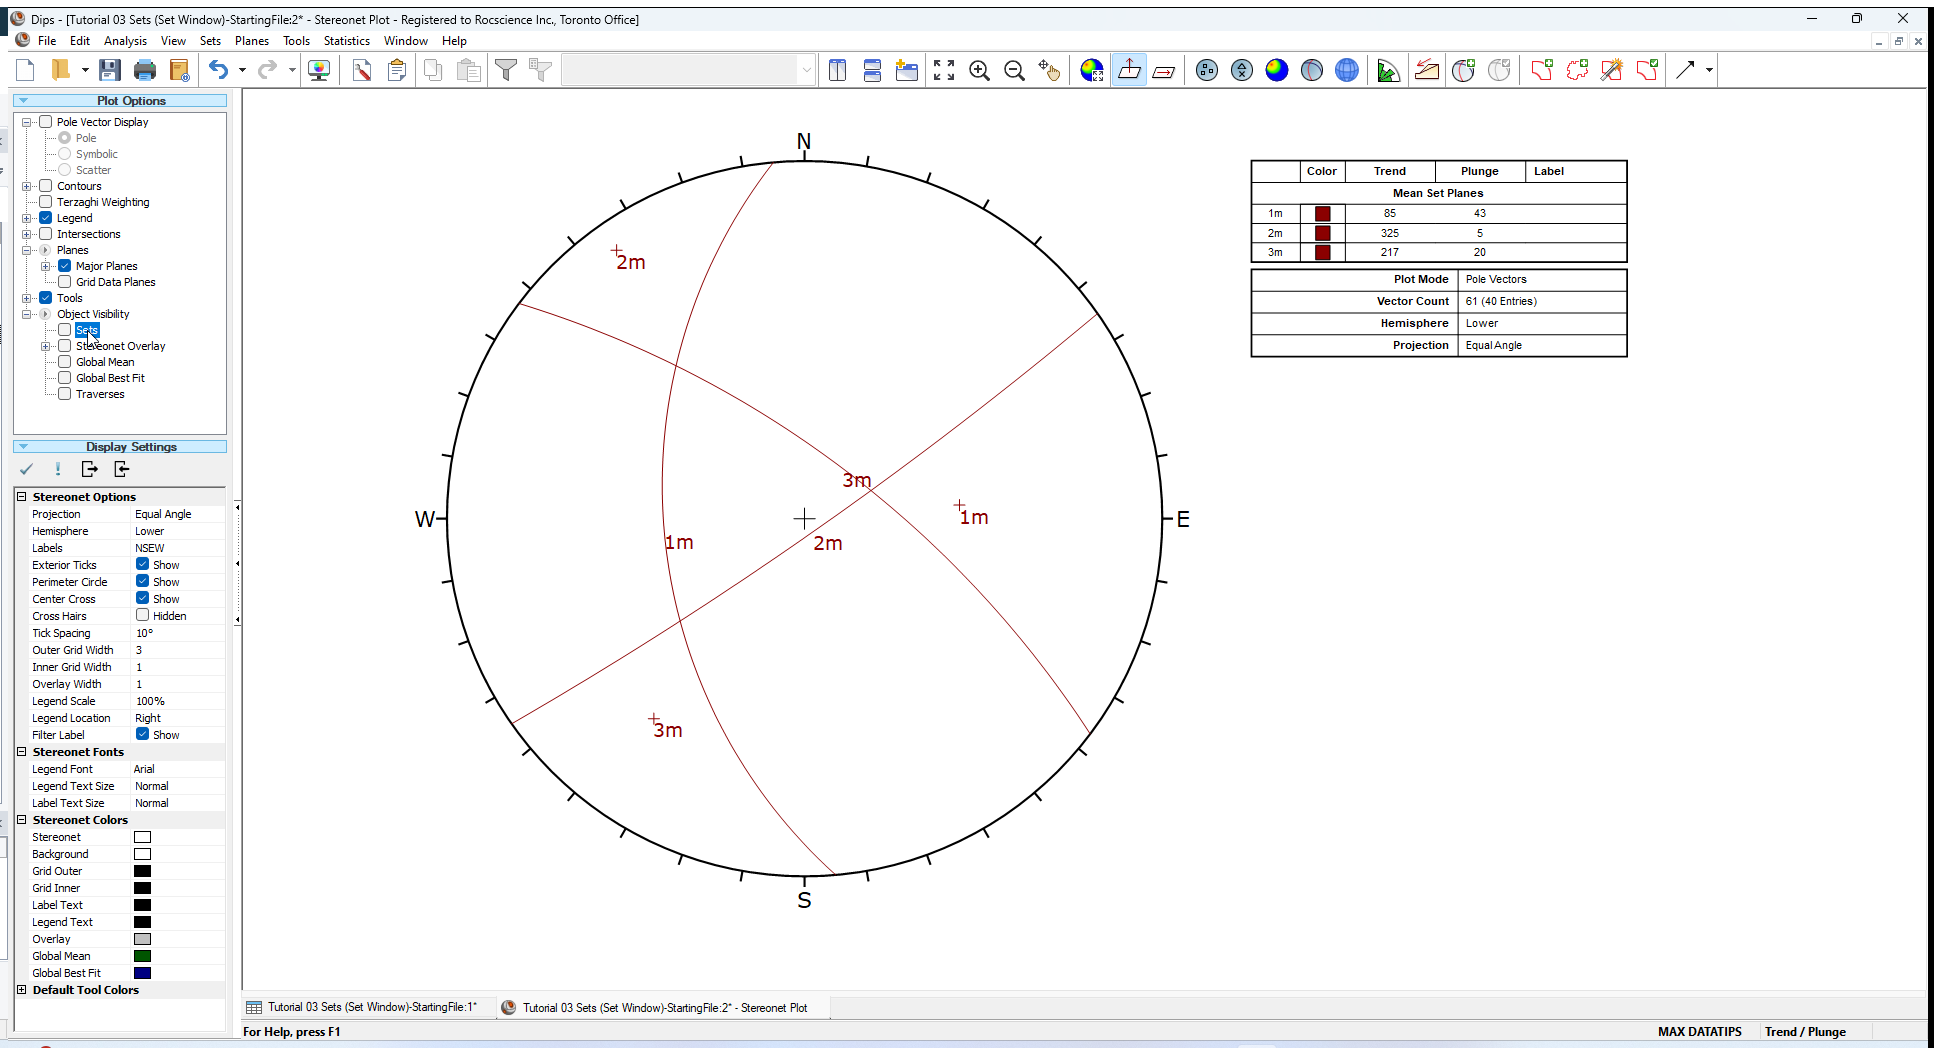
The display of Set Windows can be toggled off in the Sidebar Plot Options.
Turn off the display of Set Windows:
- Uncheck the Object Visibility > Sets checkbox in the Sidebar.
5.1 MAJOR PLANES LEGEND
The Major Planes Legend displays the orientations of planes in the format governed by the Convention (Trend / Plunge or Plane Vector). Remember that the Convention can be toggled at any time in the Status Bar, and will automatically update the planes Legend.
NOTE:
- The letter “ m” beside a plane ID indicates an UNWEIGHTED MEAN PLANE for a Set
- The letter “ w” beside a plane ID indicates a WEIGHTED MEAN PLANE for a Set
- The Terzaghi Weighting option in the Sidebar or View menu is used to toggle between weighted and unweighted results
- A Plane ID with NO letter indicates an added User Plane created with the Add User Plane
 option.
5.2 PLANE VISIBILITY
Regarding plane visibility it is worth noting:
- In the Sidebar Plot Options, the Planes > Major Planes option can be used to show / hide all major planes (User Planes and/or Mean Set Planes). This can be customized per view, if you have multiple Stereonet Plot Views open.
- In the Edit User Planes and Edit Sets dialogs, the Visibility settings can be customized for individual planes. These settings are global and apply to all views in the current file, if you have multiple Stereonet Plot views open.
5.3 PLANE COLOURS
The default colours used for planes in DIPS are:
- Green for all User Planes
- Red for all Mean Set Planes
You can customize:
- User Plane colours in the Edit User Planes dialog by selecting the Edit Planes
 option in the Planes menu.
 - Mean Set Plane colours in the Edit Sets dialog by selecting the Edit Sets
 option in the Sets menu.
This is left as an optional exercise.
This concludes the tutorial. You are now ready for the next tutorial, Tutorial 04 - Sets (Add Set Window Freehand) in DIPS.