Rocscience International Conference 2025 is going to take place in Sydney, Australia Read more

Search Results

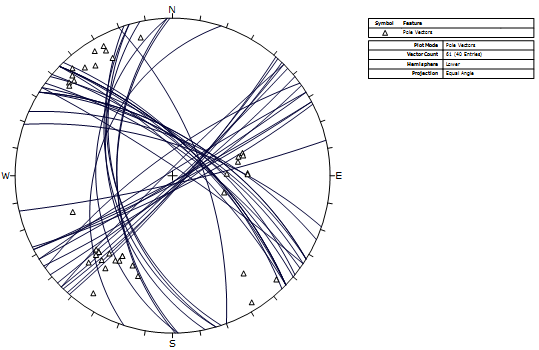
Show Grid Data Planes

To display ALL of the planes (great circles) corresponding to all of the data (poles) in a Dips file:

  • In the Sidebar Plot Options, select Planes > Grid Data Planes

Grid data planes displayed on pole plot

grid data planes pole plot

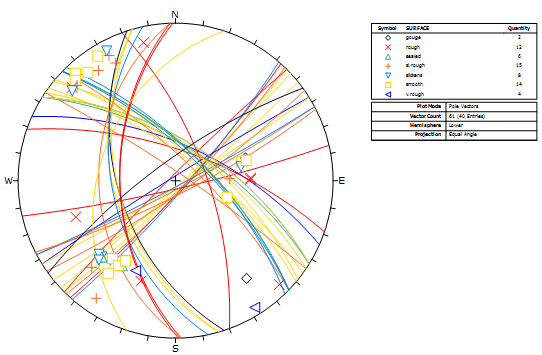
On a Symbolic Plot the colour of the planes displayed will correspond to the colour of the symbols used for the poles.

Grid data planes displayed on symbolic pole plot

grid data planes symbolic pole plot

Rocscience logo, click here to return to the homepage Portal Account Portal Account Log In Log Out Home Shopping Cart icon Click here to search our site Click here to close Learning Tech Support Documentation Info Chevron Delete Back to Top View More" Previous Next PDF File Calendar Location Language Fees Video Click here to visit Rocscience's LinkedIn page Click here to visit Rocscience's YouTube page Click here to visit Rocscience's X page Click here to visit Rocscience's Facebook page Click here to visit Rocscience's Instagram page Click here to visit Rocscience's Reddit page Bookmark Network Scroll down for more Checkmark Download Print Back to top Single User Multiple Users RSLog RocFall3 CPillar Dips EX3 RocFall RocPlane RocSlope3 RocSupport RocTopple RS2 RS3 RSData RSPile Settle3 Slide2 Slide3 SWedge UnWedge RocTunnel RocSlope2 Commercial License Education License Trial License Shop safe & secure Money-back guarantee