2 - Elastic Analysis of Rectangular Roof Beam
In Tutorial 01 - CPillar Quick Start (Rigid Analysis of Square Pillar), you learned about the two main analysis types in CPillar: Deterministic, and Probabilistic, and how to run a Deterministic analysis (the default). In this tutorial, you will learn how to run a Probabilistic analysis.
In a Probabilistic analysis, statistical input data can be entered to account for uncertainty in geometry, lateral stress, and strength values. The result is a distribution of Factors of Safety, from which a Probability of Failure is calculated. To learn more about Probabilistic Analysis, see Probabilistic Analysis in CPillar.
Topics Covered in this Tutorial:
- Project Settings
- Random Variables
- Roof Beam Model
- Probabilistic Analysis
- Elastic Analysis for Rectangular Pillar
- Hoek-Brown Strength Criterion
- Constant Lateral Stress
- Failure Modes
- Histogram Plot
Finished Product:
The finished product of this tutorial can be found in the Tutorial 02 Elastic Analysis of Rectangular Roof Beam (Long Excavation).cpil5 file, located in the Examples > Tutorials folder in your CPillar installation folder.
1.0 Introduction
This model represents a roof beam (10 x 100 m) with a thickness of 1 m. There is also 1 m of overburden having the same density as the beam.
The lateral stress is defined as a constant. Lateral effective stresses of 2 ± 0.5 MPa in both the x and y directions will be used.
2.0 Creating a New File
If you have not already done so, run the CPillar program by double-clicking the CPillar icon in your installation folder or by selecting Programs > Rocscience > CPillar > CPillar in the Windows Start menu.
When the program starts, a default model is automatically created. If you do NOT see a model on your screen:
- Select: File > New

Whenever a new file is created, the default input data forms valid pillar geometry, as shown in the image below.
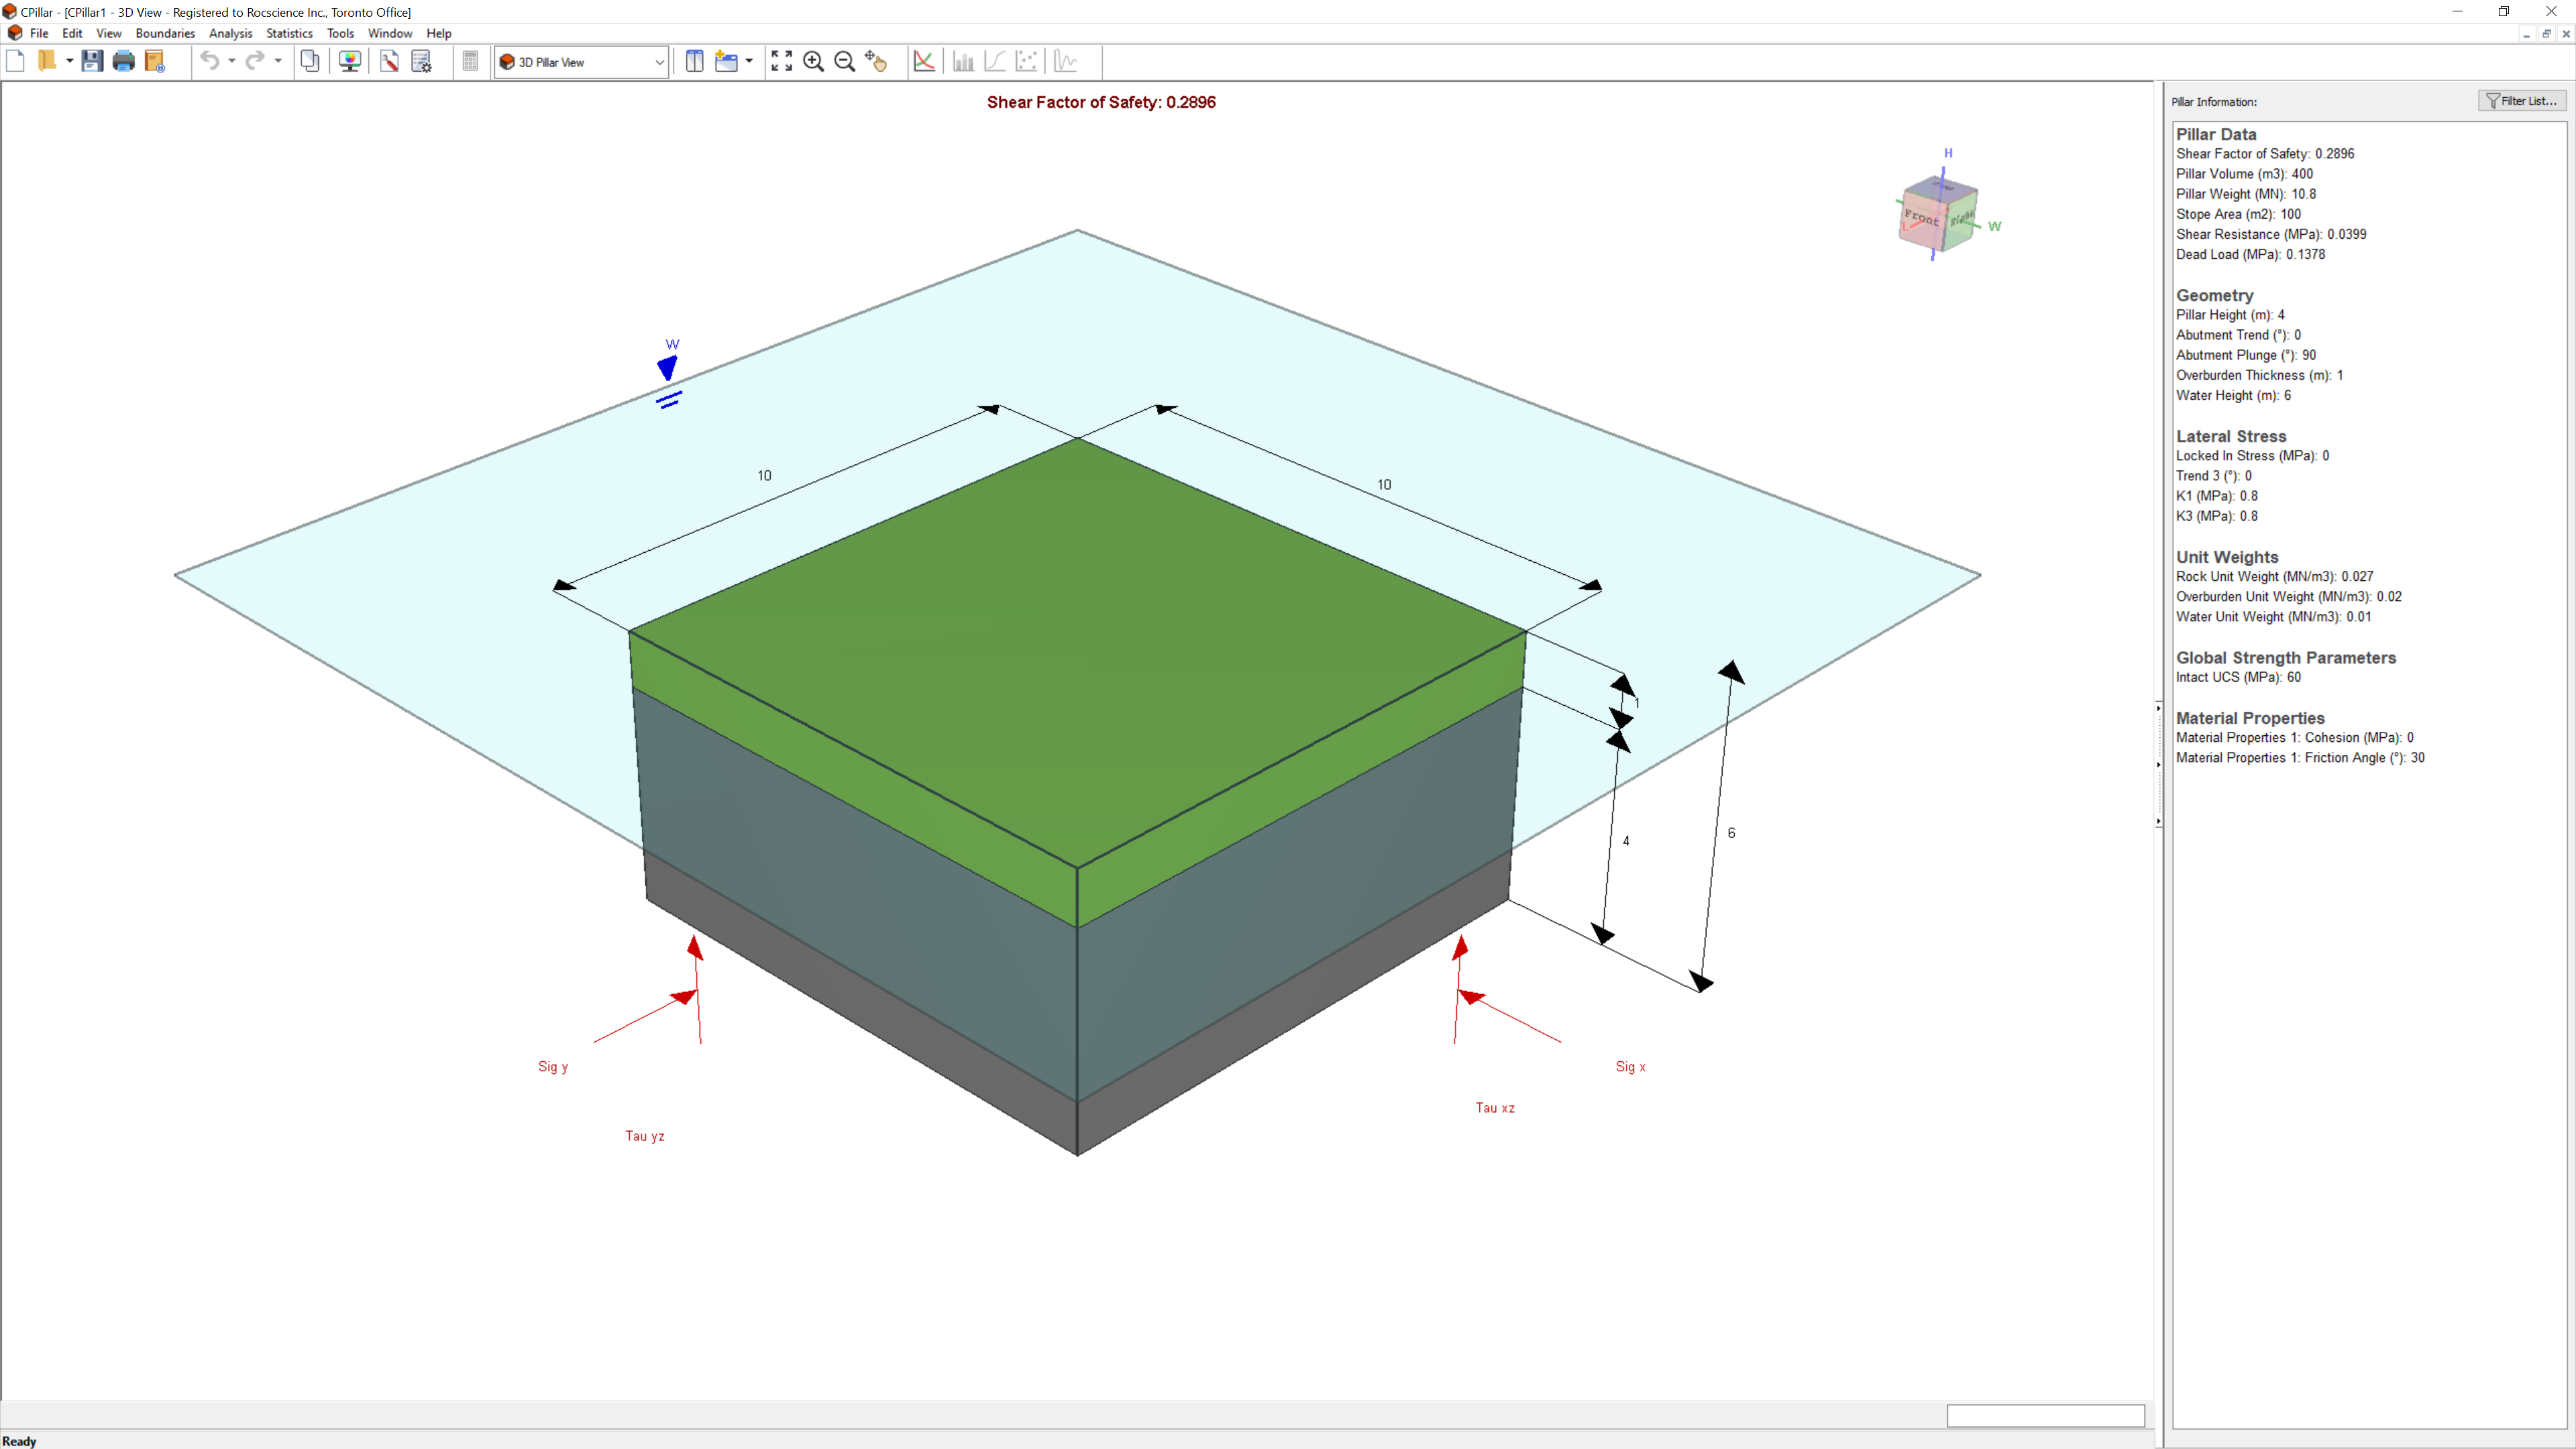
If the CPillar application window is not already maximized, maximize it now so that the full screen is available for viewing the model. You will have a 3D pillar displayed on the screen in isometric orientation.
3.0 Project Settings
The Project Settings dialog allows you to configure the main analysis parameters for your model, such as Units, Analysis Type, and Sampling Method.
3.1 General
- Select Project Settings
 from the toolbar or the Analysis menu.
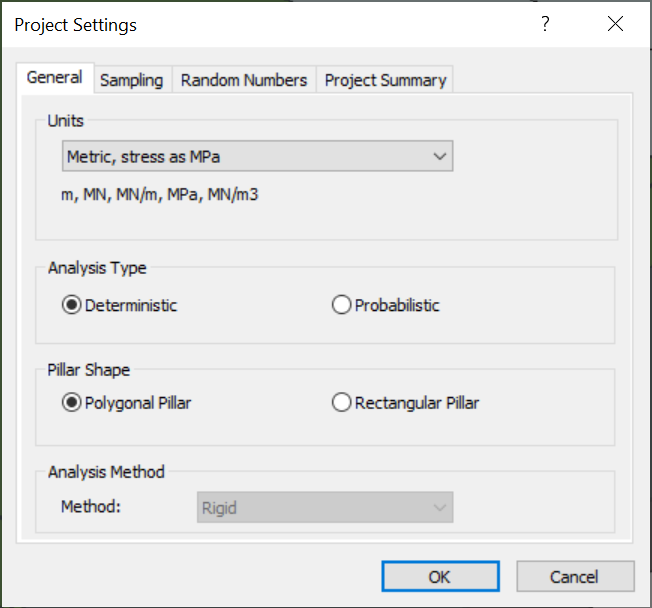
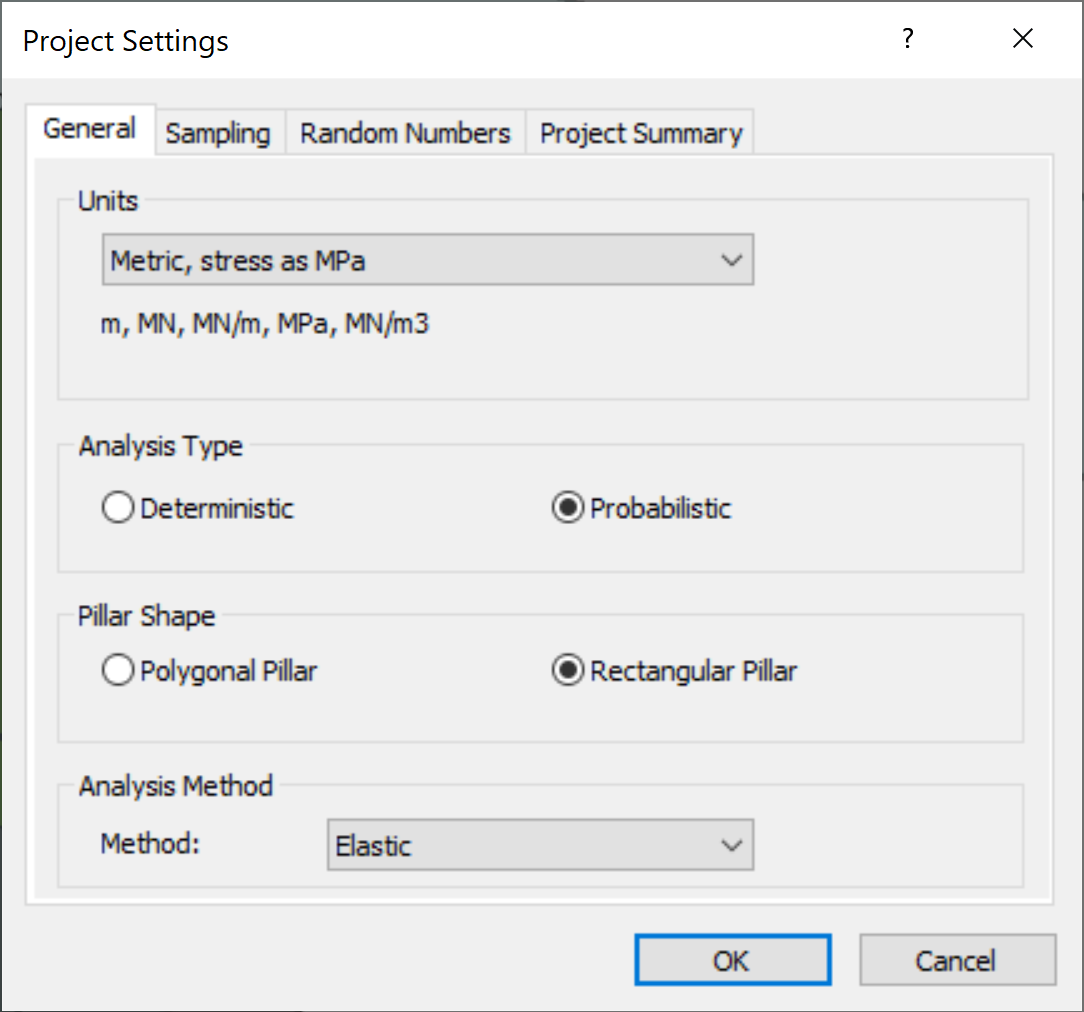
- Navigate to the General tab.
- Ensure Units = Metric, stress as MPa (default setting).
- Set Analysis Type = Probabilistic.
- Set Pillar Shape = Rectangular Pillar.
NOTE: The Elastic analysis is formulated for a rectangular thin plate. Therefore, the Pillar Shape must be set to Rectangular Pillar. - Set Analysis Method = Elastic.
3.2 Sampling
The Sampling Method determines how the statistical distribution for the random input variables will be sampled. For each sample, the computed Factor of Safety is compared against the Design Factor of Safety to determine the Probability of Failure for all samples. Any computed Factor of Safety < Design Factor of Safety is considered a failed pillar for the applicable failure mode.
- Navigate to the Sampling tab of the Project Settings dialog.
- Leave the default values.
Sampling Method = Latin HyperCube
Number of Samples = 5000
Design Shear Factor of Safety = 1
Design Elastic Factor of Safety = 1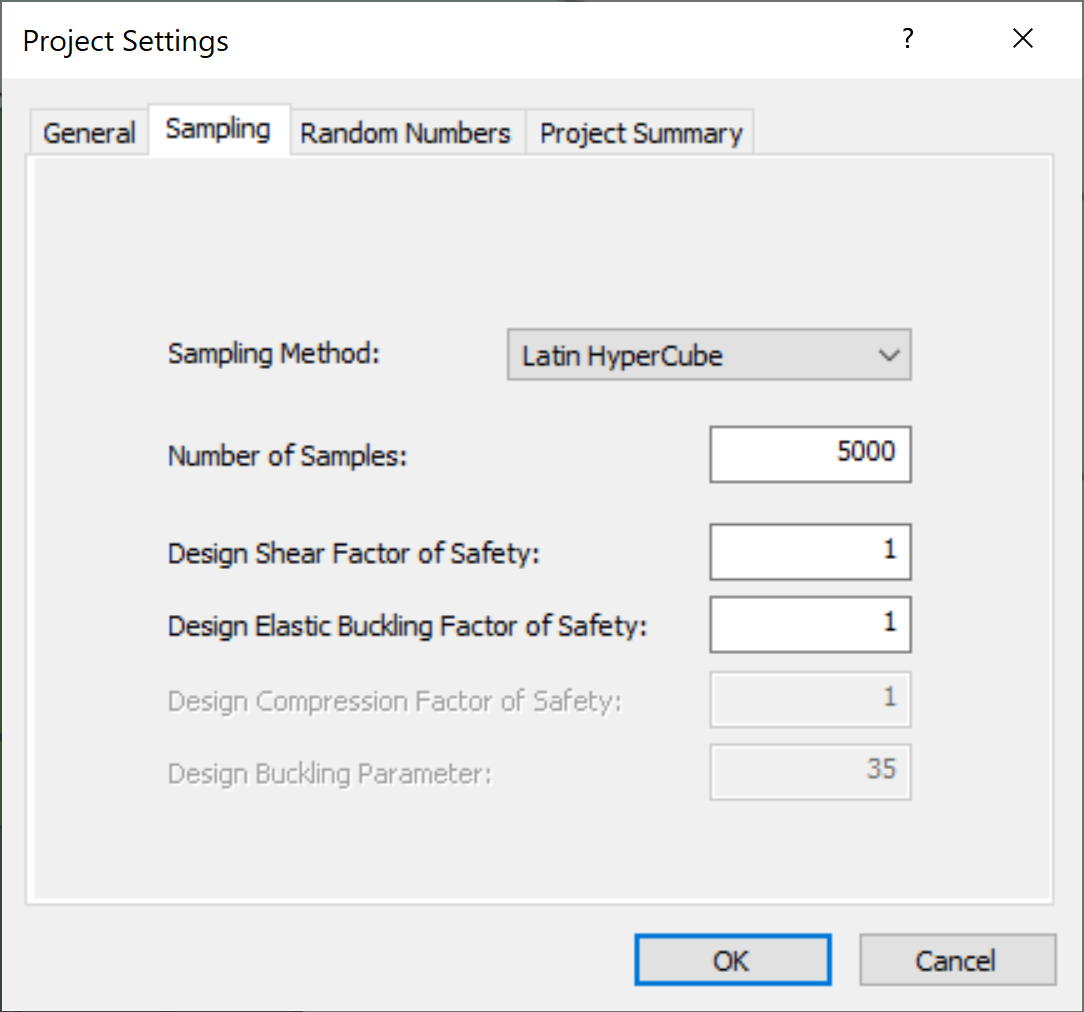
For more information, see Sampling.
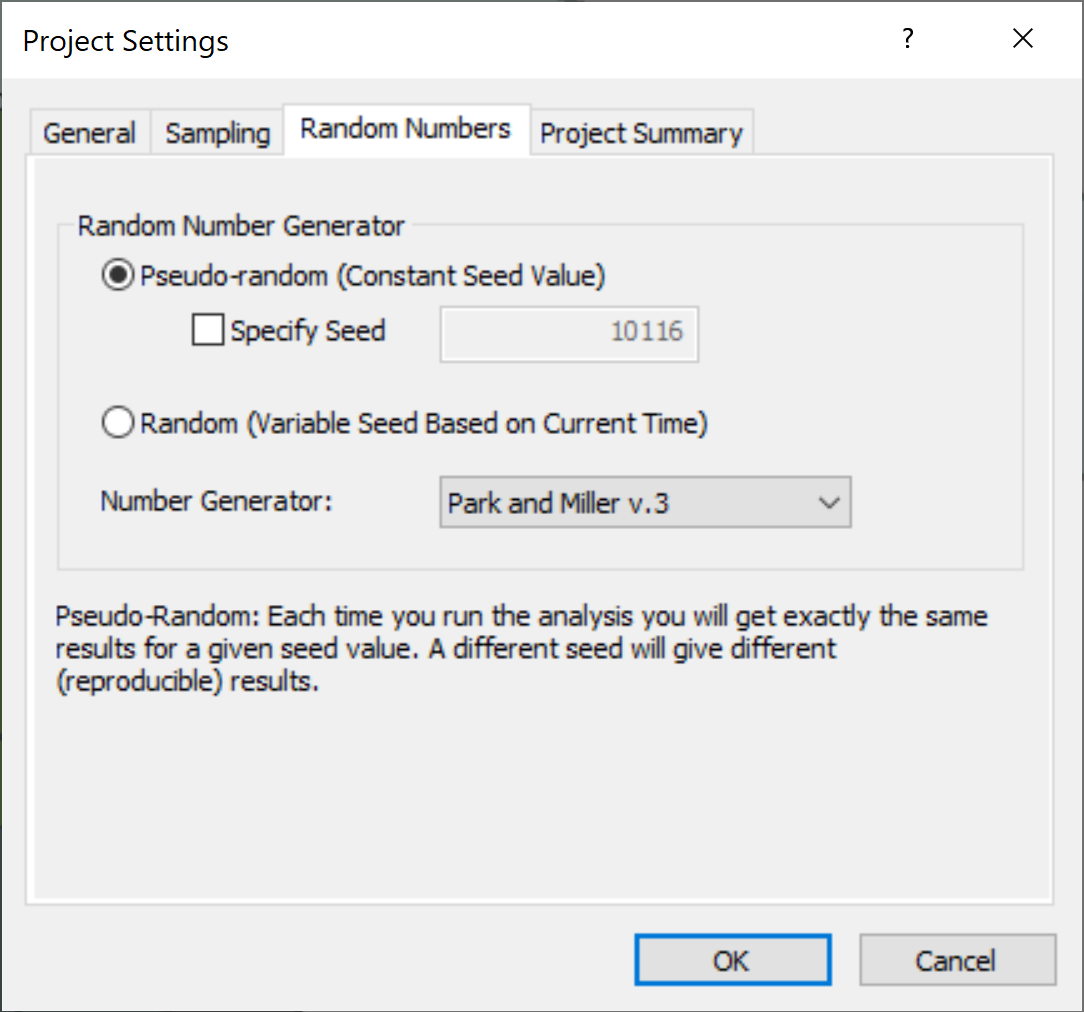
3.3 Random Numbers
- Navigate to the Random Numbers tab of the Project Settings dialog.
- Note that the Random Number Generation = Pseudo-random with a constant seed value. This ensures that Probabilistic results are reproducible for the exact same set of inputs every time you run Compute.
3.4 Project Summary
- Navigate to the Project Summary tab of the Project Settings dialog.
- Enter CPillar Elastic Analysis of Rectangular Roof Beam Tutorial as the Project Title.
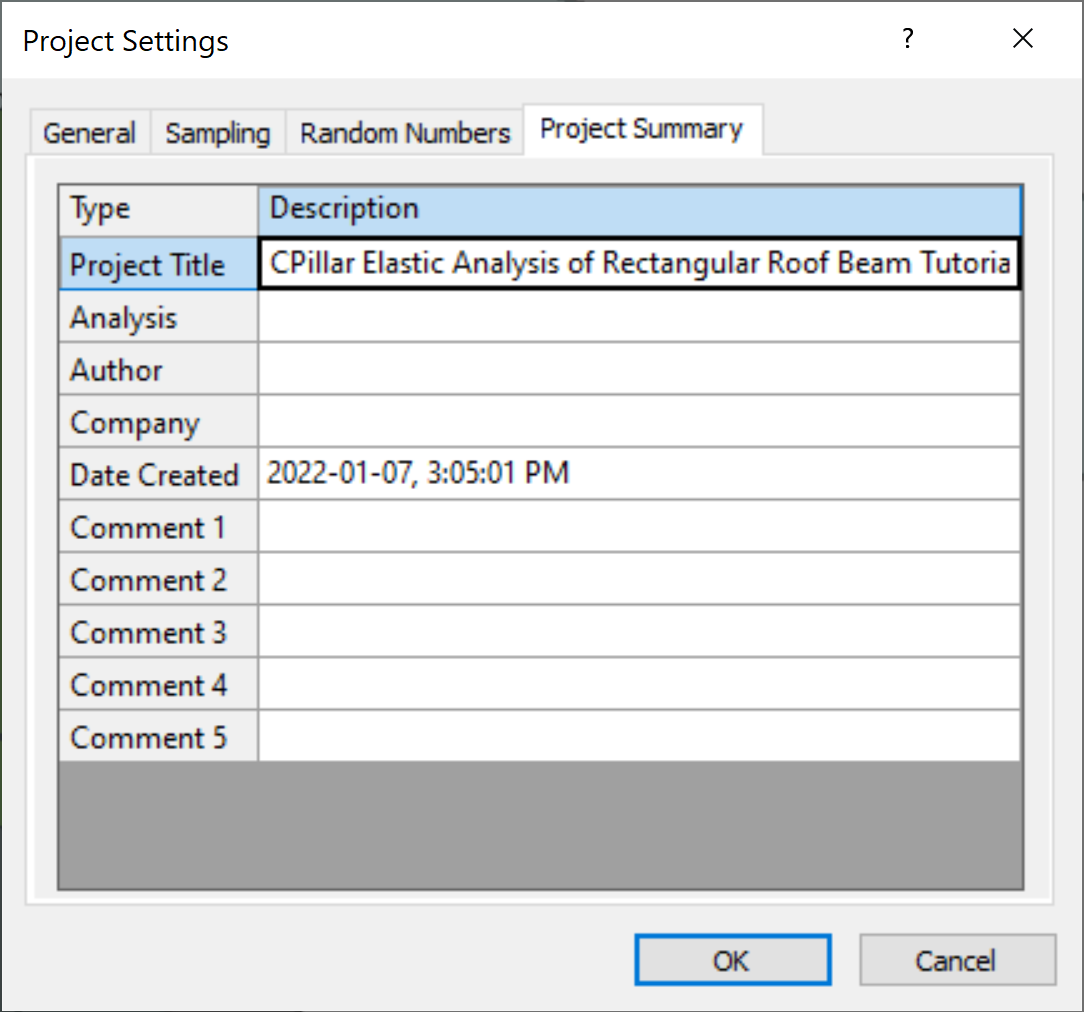
- Click OK to close the Project Settings dialog.
4.0 Mean Input Data
Autocompute is turned ON by default when performing a Probabilistic analysis. Autocompute will automatically compute the model every time a change is made in Input Data.
In CPillar, the input parameters are entered in the Input Data dialog. The Input Data dialog is organized under four tabs: Geometry, Stresses, Material Properties, and Rock Mass and Abutment Strength. To change a parameter, click on the value and enter the new value or select from the dropdown as necessary. The model will reflect any changes, immediately. Mean values are entered directly in the edit controls in the Input Data dialog.
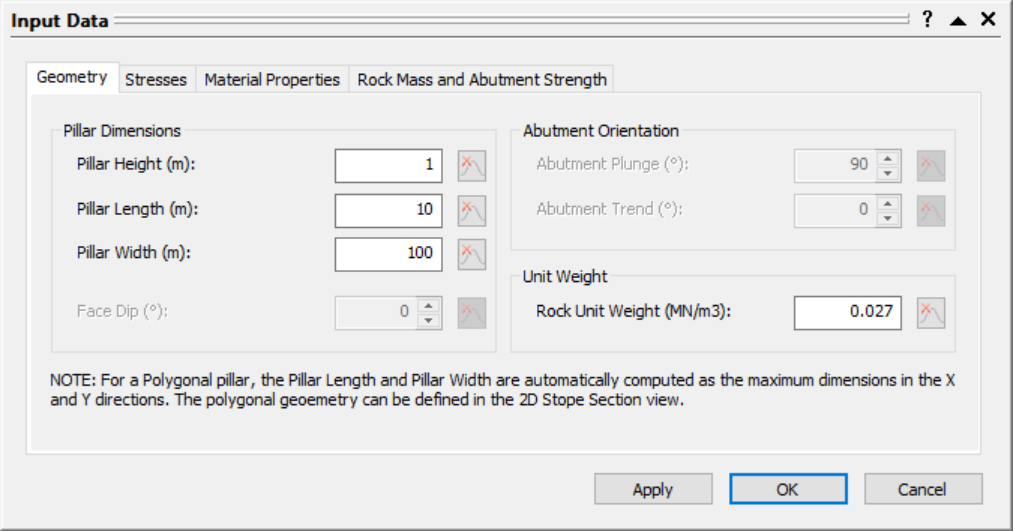
4.1 Geometry
To set up the analysis in the Input Data dialog:
- Select Input Data
 from the toolbar or Analysis menu.
 - Navigate to the Geometry tab.
- Enter the following mean data for the Pillar Dimension parameters:
- Mean Pillar Height = 1 m
- Mean Pillar Length = 10 m
- Mean Pillar Width = 100 m
- Enter the following mean data for the Unit Weight parameter:
- Mean Rock Unit Weight = 0.027 MN/m3
- Mean Rock Unit Weight = 0.027 MN/m3
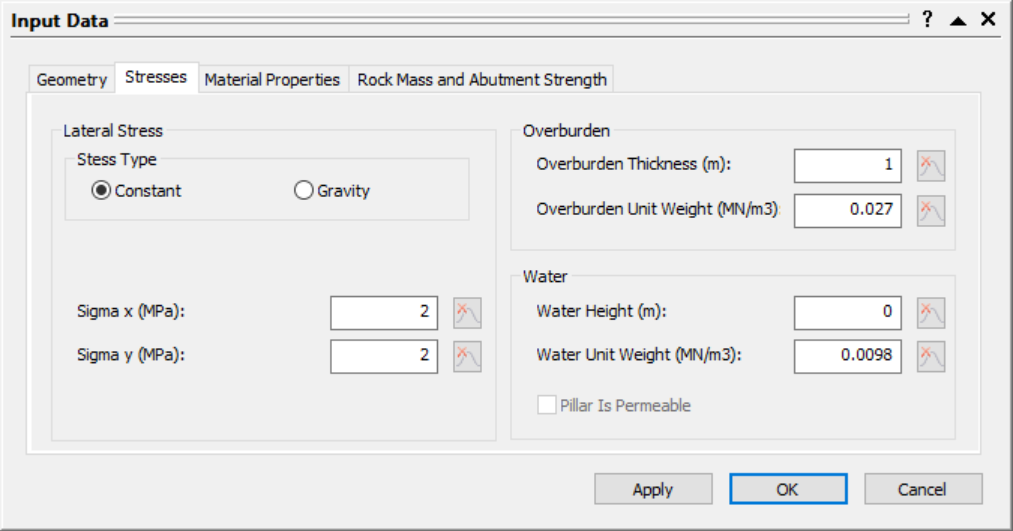
4.2 Stresses
Enter the following mean data for the stress parameters:
- Navigate to the Stresses tab of the Input Data dialog.
- Enter the following mean data for the Lateral Stress parameters:
- Stress Type = Constant.
- Mean Horizontal Sigma x = 2 MPa
- Mean Horizontal Sigma y = 2 MPa
- Enter the following mean data for the Overburden parameters:
- Mean Overburden Thickness = 1 m
- Mean Overburden Unit Weight = 0.027 MN/m3
- Enter the following mean data for the Water parameters:
- Mean Water Height = 0 m
- Mean Water Unit Weight = 0.0098 MN/m3
- Pillar Is Permeable = No
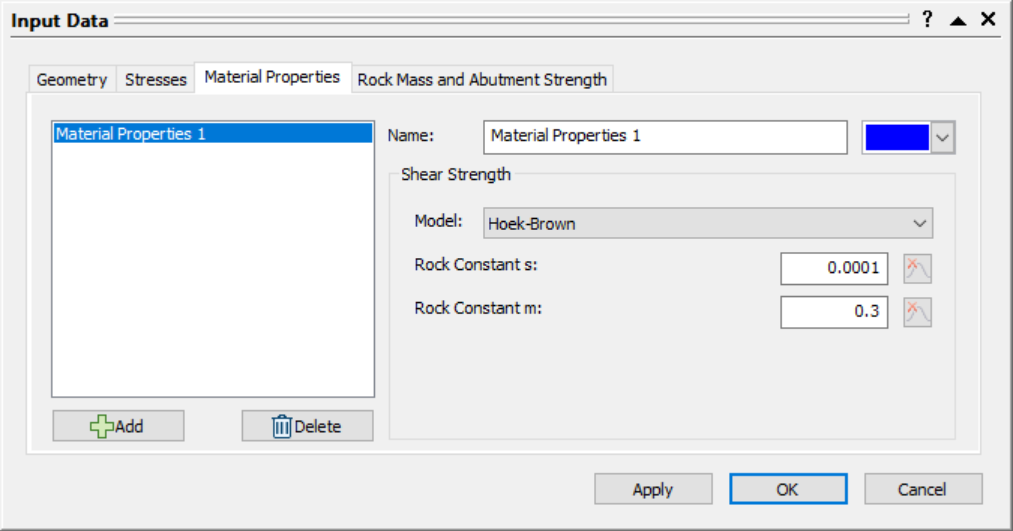
4.3 Material Properties
Enter the following mean data for the shear strength parameters:
- Navigate to the Material Properties tab of the Input Data dialog.
- Enter the following mean data for the Material Properties 1:
- Strength Type = Hoek-Brown
- Mean Rock Mass s Value = 0.0001
- Mean Rock Mass m Value = 0.3
4.4 Rock Mass and Abutment Strength
Enter the following mean data for the rock mass parameters:
- Navigate to the Rock Mass and Abutment Strength tab of the Input Data dialog.
- Enter the following mean data for the Rock Mass parameters:
- Mean Intact UCS = 50 MPa
- Mean Rock Mass Modulus = 5000 MPa
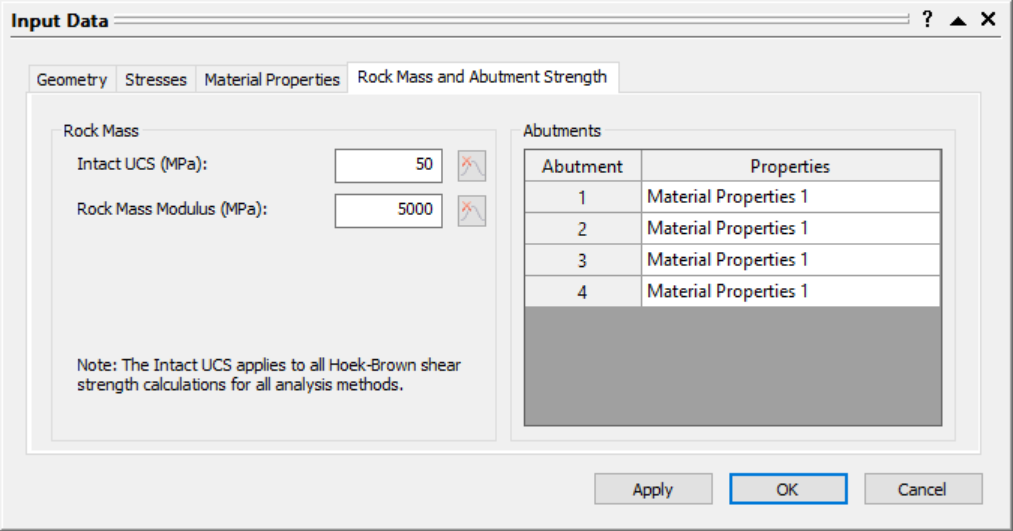
- Click OK to apply the changes and close the dialog.
The 3D Pillar View shows an isometric perspective of a 3D pillar model with principle stresses and dimensions labeled:

5.0 Random Variables
In order to perform a Probabilistic analysis, at least one random variable must be assigned a statistical distribution. The Statistical Distribution can be assigned by either:
- Clicking on the distribution icon to the left of the mean parameter value in the Input Data dialog; or
- In the Statistics dialogs.
To model the parameters as random variables in the Geometry and Stress Statistics dialog:
- Select Geometry and Stress
 from the Statistics menu.
 - Click the Add
 button and set the following:
- Property = Sigma x
- Distribution = Normal
- Std. Dev. = 0.5 MPa
- Rel. Min and Rel. Max = 1.5 MPa.
- Click the Add button and set the following:
- Property = Sigma y
- Distribution = Normal
- Std. Dev. = 0.5 MPa
- Rel. Min and Rel. Max = 1.5 MPa.
- Click the Add button and set the following:
- Property = Intact UCS
- Distribution = Normal
- Std. Dev. = 5 MPa
- Rel. Min and Rel. Max = 15 MPa.
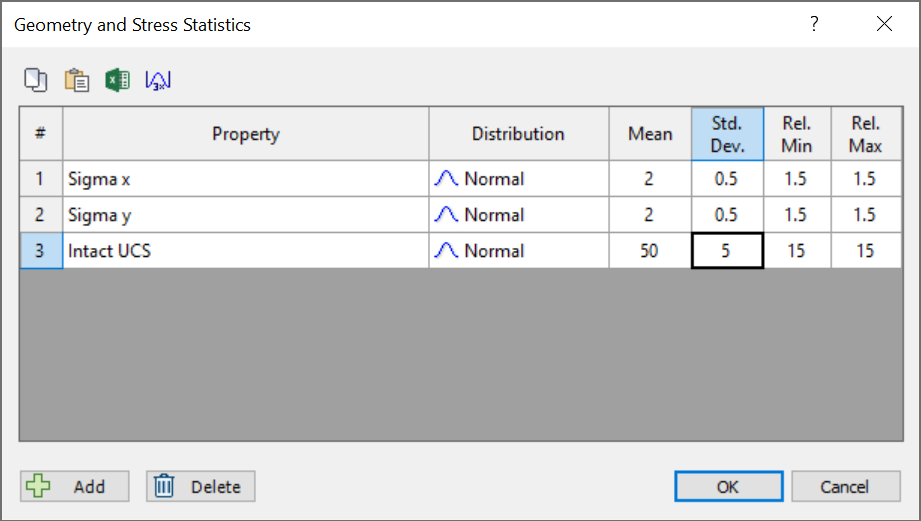
- Select OK.
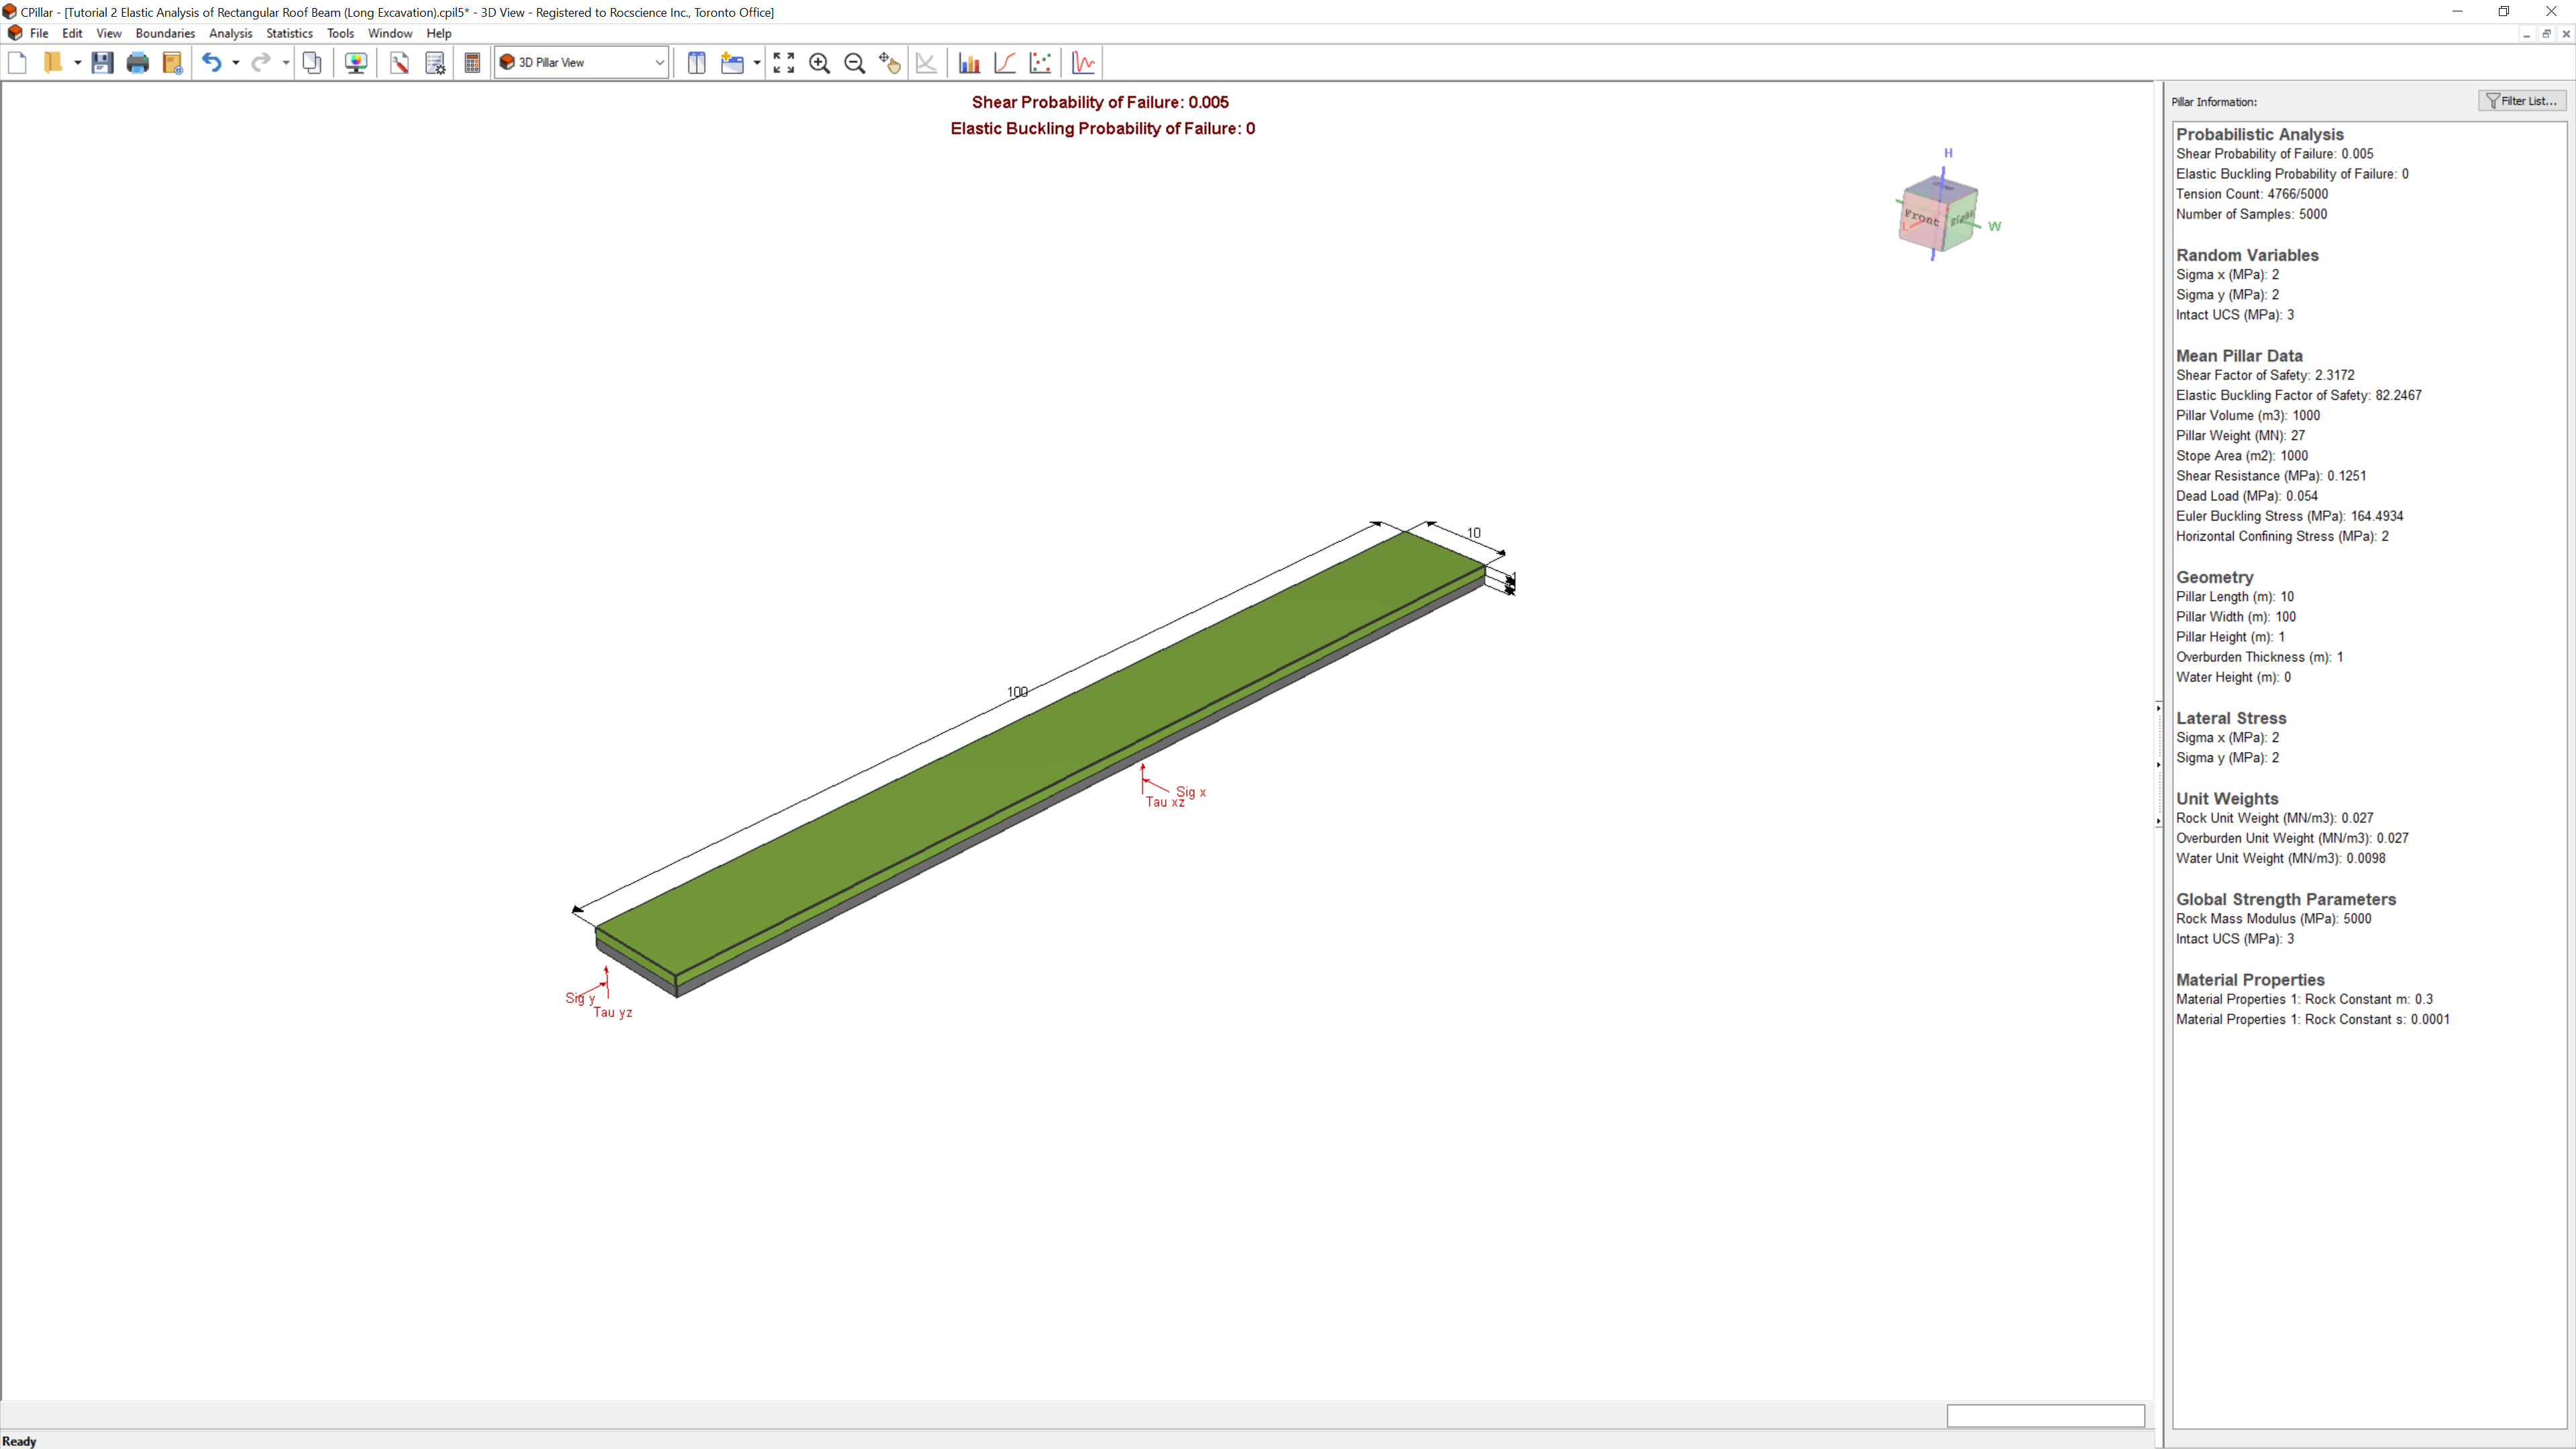
The 3D Pillar View shows an isometric perspective of a probabilistic 3D pillar model with principle stresses and dimensions labelled:

The list of Random Variables defined are listed under Pillar Information in the Sidebar.
6.0 Analysis Results
Since we have Autocompute turned ON, the model is automatically computed and shows the latest analysis results for the current inputs.
The primary result from an CPillar Probabilistic analysis is the pillar Probability of Failure. The Probability of Failure is displayed at the top-center of the 3D Pillar View and in the Pillar Information pane. The Pillar Information pane appears in the Sidebar on the right side of the CPillar application window and displays a summary of analysis results.
Depending on the Analysis Method (i.e., Rigid, Elastic, or Voussoir), additional data is also presented. Note that since this is an Elastic analysis, two failure modes are considered:
- Shear (vertical slippage at the abutments), and
- Elastic Buckling.
Both the Shear Probability of Failure and Elastic Buckling Probability of Failure are 0.0000 or 0%.
For an Elastic analysis, the Tension Count is also displayed. The Tension Count indicates the number of cases where the shear strength was lowered due to bending induced tensile stresses. See Elastic Analysis for more information on how the Factor of Safety is computed. Notice that a majority of the samples have corrected shear strength (Tension Count = 4766/5000). This is due to the fact that we are modelling a long pillar, with Pillar Width much greater than Pillar Length.
Elastic Buckling will generally not be the governing mode of failure for an Elastic analysis. The mean Elastic Buckling Factor of Safety will generally be very large. Elastic buckling will only be an issue if:
- Lateral stresses are high, and/or
- Span/depth ratio is high, and/or
- Rock mass modulus is low.
7.0 Probability of Failure Histogram
Now let's reduce the Mean Intact UCS value and see how it affects the Shear Probability of Failure.
- Select Input Data from the toolbar or Analysis menu.
- Navigate to the Rock Mass and Abutment Strength tab.
- Set the Mean Intact UCS = 3 MPa.
- Click the distribution icon
 to the left of Intact UCS, and change:
- Std. Dev. = 0.5 MPa
- Rel. Min and Rel. Max = 1.5 MPa (3x Std. Dev.)
- Click OK to close the Distribution popup.
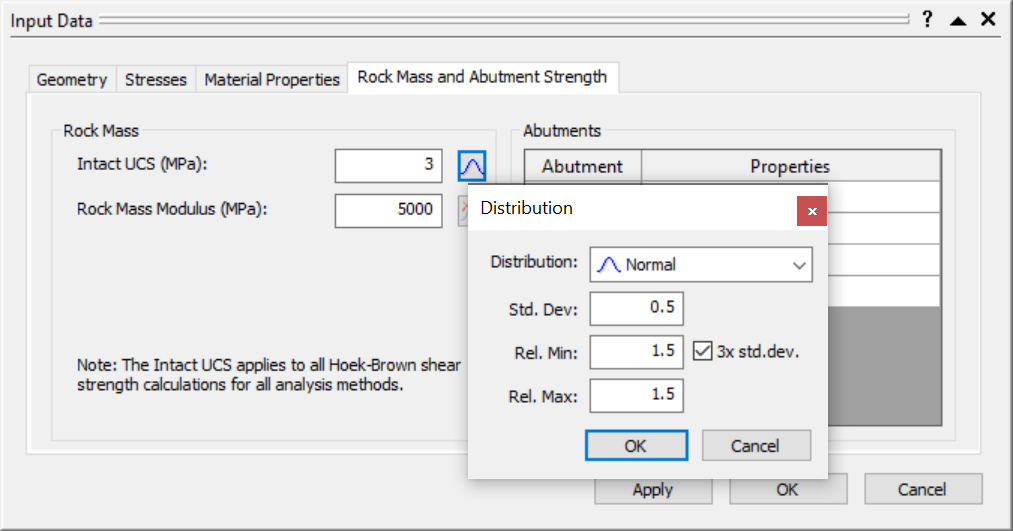
- Click OK to apply the changes and close the Input Data dialog.
The Shear Probability of Failure is now 0.005 or 0.5%:
It is helpful to plot a histogram of the data, in order to see the meaning of the Probability of Failure value.
To plot a probability of failure histogram:
- Select Plot Histogram
 from the toolbar or the Statistics menu.
 - Set Failure Mode = Shear.
- Set Data to Plot = Factor of Safety.
- Leave the default Number of Bins = 30.
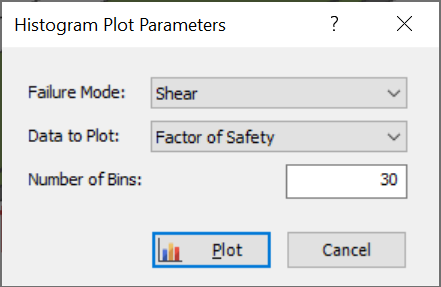
- Click Plot.
The histogram plot of Shear Factor of Safety vs. Relative Frequency is shown:
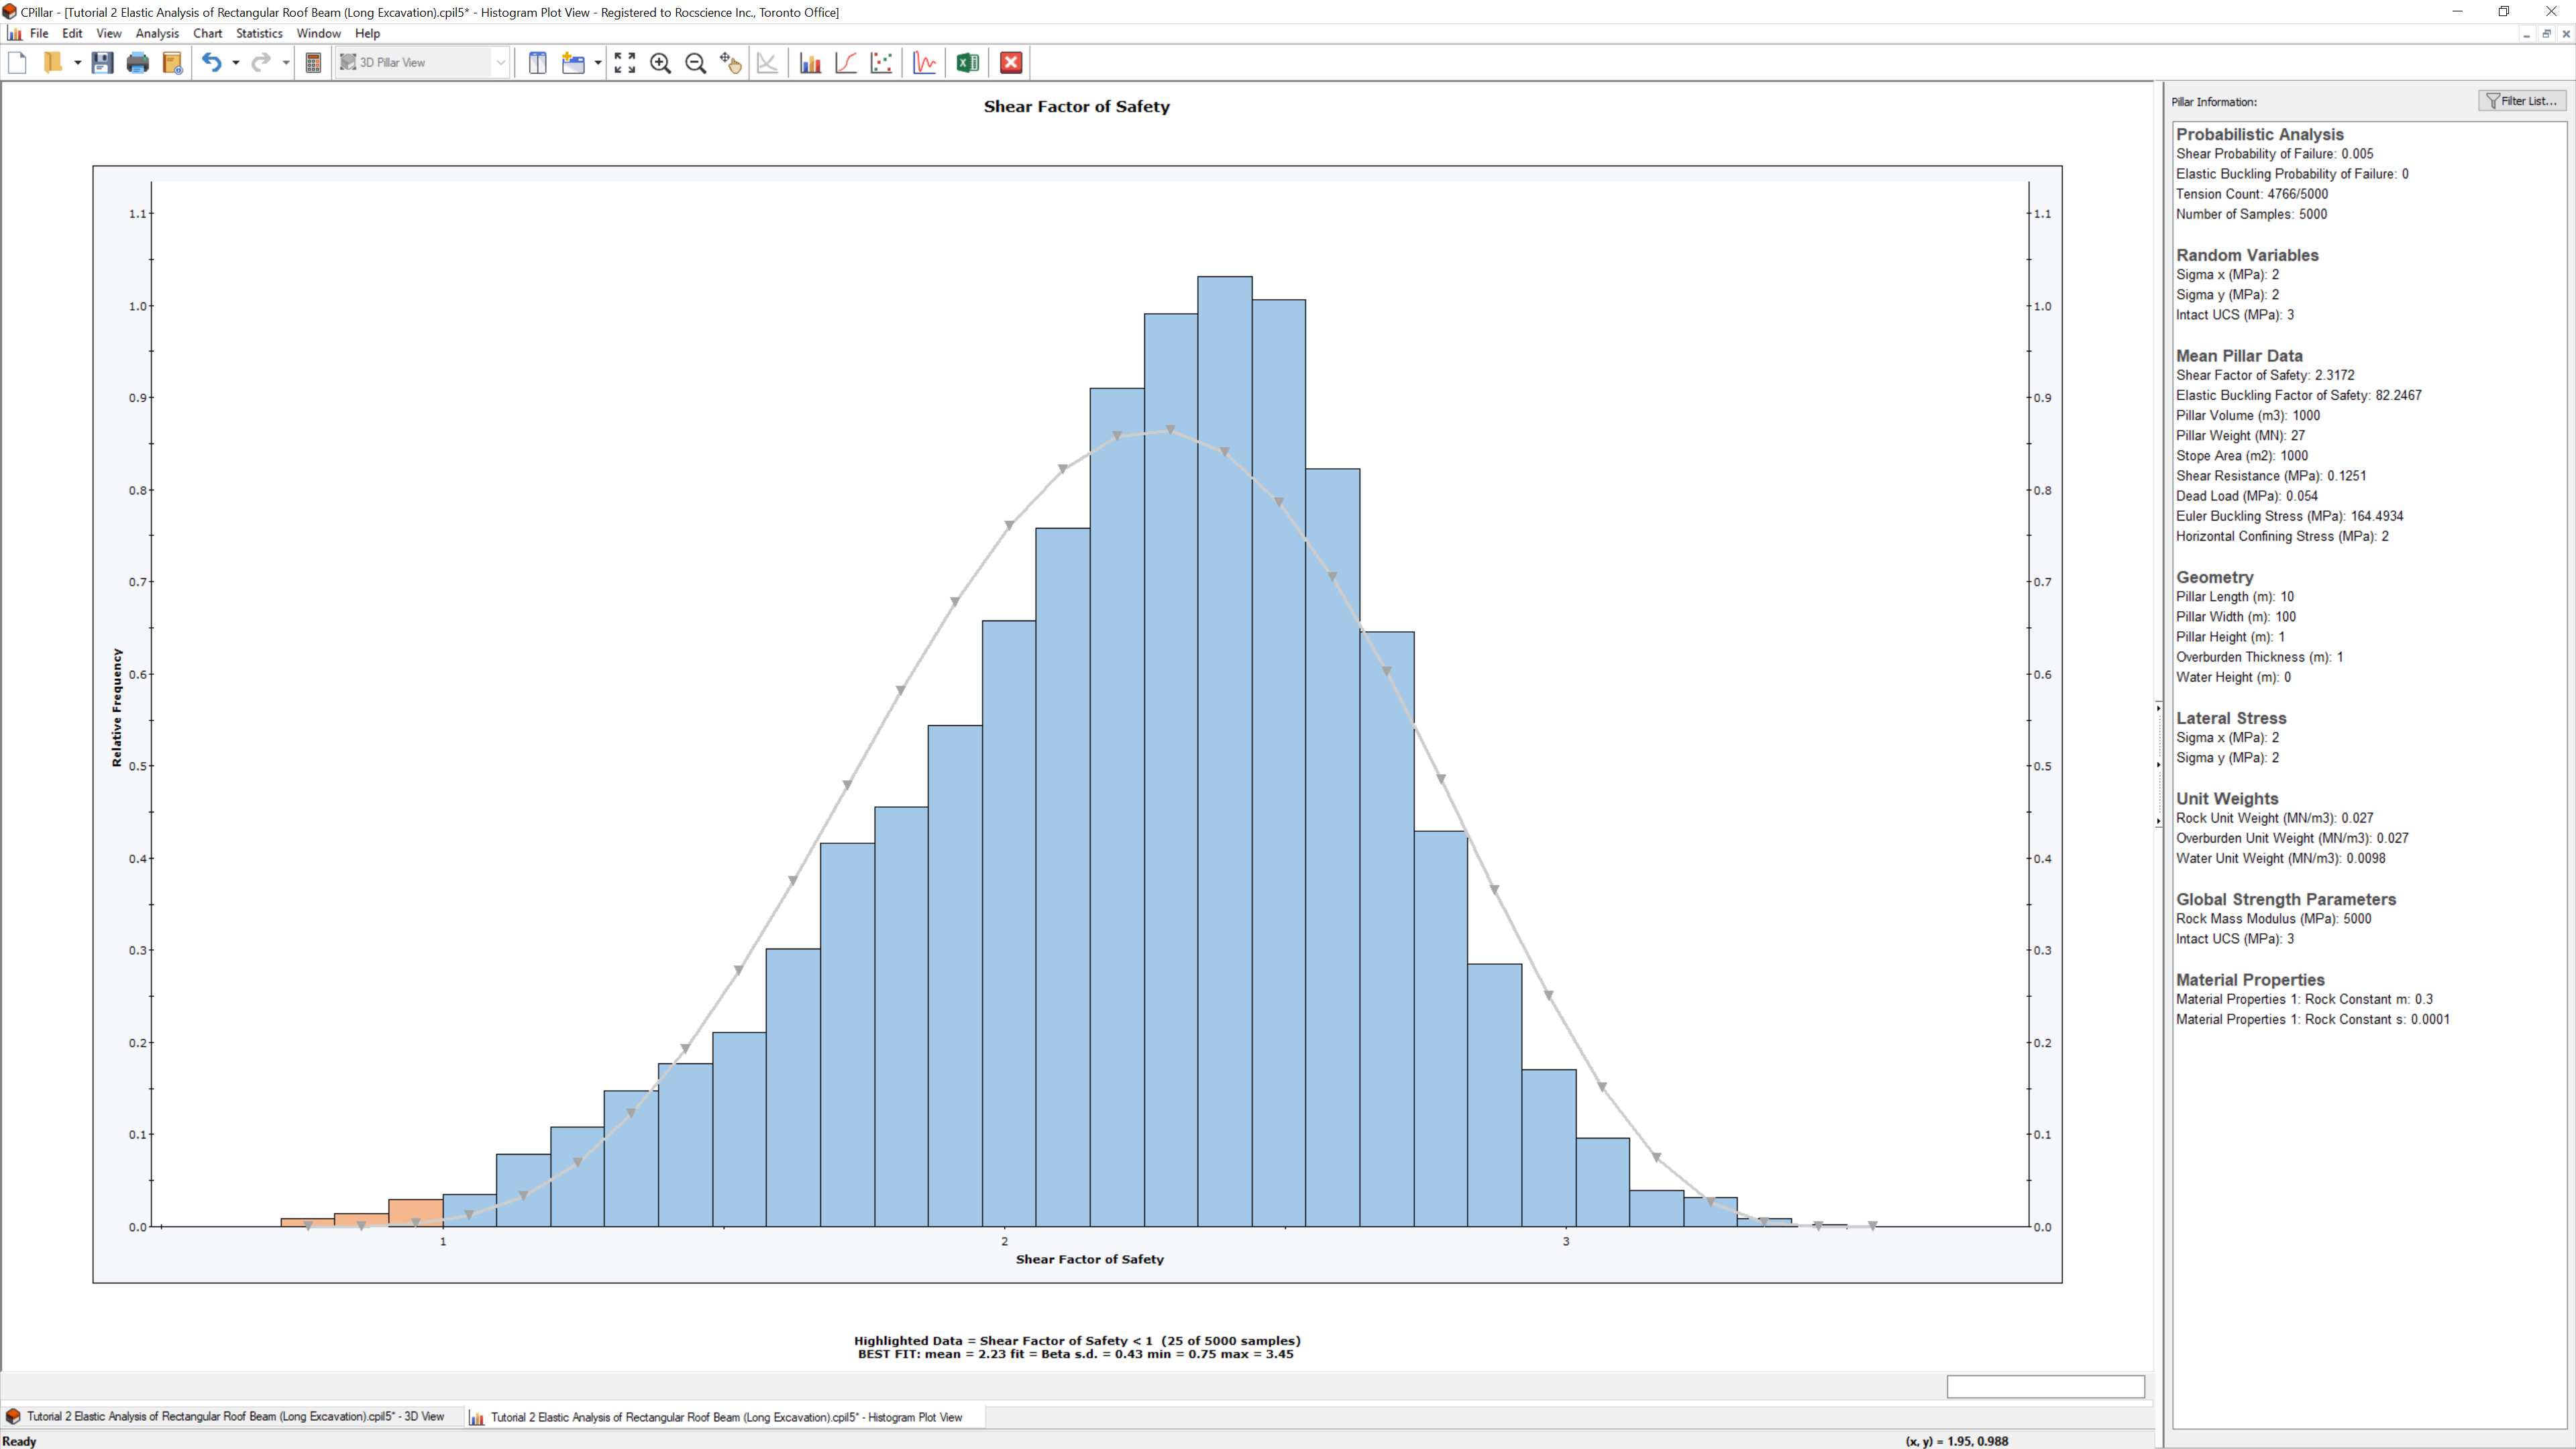
Notice the red shaded area on the left side; this represents the 0.5% Probability of Failure value. That is, this area represents the 0.5% of the 5000 samples (entered in the Project Settings dialog) which resulted in a Factor of Safety less than 1 (Design Shear Factor of Safety).
This concludes the tutorial. You can now proceed to Tutorial 03: Voussoir Analysis of Rectangular Roof Plate in CPillar.