Parametric Study: Homogeneous Slope Stability Under Rainfall with RS2
Slope failure induced by rainfall is a common geotechnical problem in tropical locations with abundant soils; landslides in Hong Kong are one such example. Soils found in tropical locations typically consist of residual soils with negative-pore water pressure in the zone above the water table.
Although it is widely recognized that rainfall infiltration plays a significant role in causing landslides; studies from multiple regions have reached different conclusions on antecedent rainfall as a significant factor for landslides. However, such mixed conclusions can be the cause of focusing on the correlation of landslides to rainfall patterns alone, rather than each of the controlling parameters.
Results from the paper by Rahardjo et al. (2007) have clearly indicated the amount of influence antecedent rainfall has directly depended on soil permeability. Therefore, the objective of the paper’s parametric study was to determine the relative importance of each controlling parameter on the instability of a homogeneous slope under rainfall duration for 24 hours.
Homogeneous Slope Analysis
The slope stability was analyzed through the factor of safety (dependent factor) and the controlling factors (independent factors): soil properties, rainfall intensity, initial groundwater table (GWT), and slope geometry.
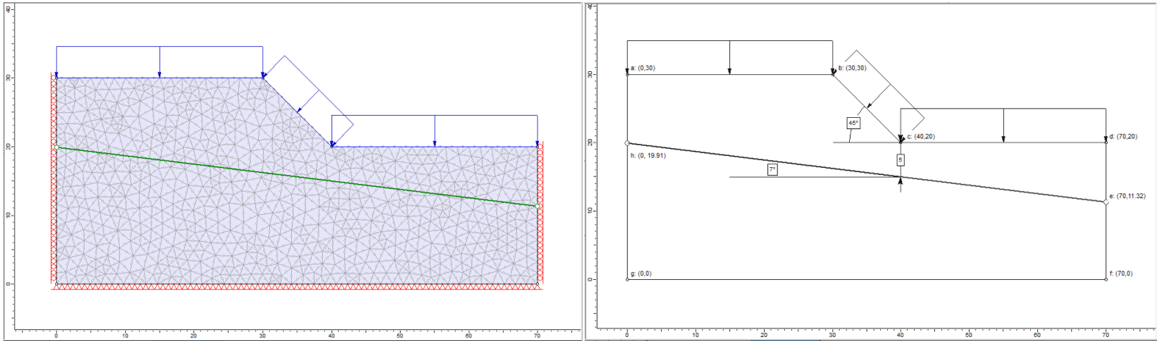
For the sake of redundancy, only the results for Series A; slope angle α = 45° were examined. In Series A, 9 tests involving a combination of three soil types, one slope angle and three rainfall intensities (3 × 1 × 3) were performed where both the slope height HS = 10 m, GWT inclination = 7°, and GWT depth HW = 5 m were kept constant.
Three sets of soil types f10, - 4 , f50, - 5 , and f100, - 6 were selected for the study based on saturated coefficients of permeability of typical residual soils in Singapore. Where the symbol f represents fine-grained soil and the numerical subscript represents the saturated coefficient of permeability of the soil KS. In general, f10, - 4 represents a fine-grained sandy soil, f50, - 5
represents a fine-grained silty soil, and f100, - 6 , a fine-grained clayey soil. The homogenous soil slope was subjected to rainfall intensities of 9, 80, and 1 KS mm/h for 24 hours in a combination with each of the three soil types.
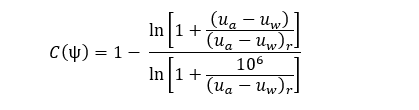
For the derivation of the SWCC of the soils, the Fredlund and Xing (1994) equation:
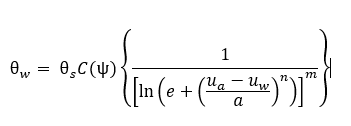
with correction factor C(ψ) of 1, as recommended by Leong and Rahardjo (1997) was used.
The permeability function of the soils was derived using the following equation proposed by Leong and Rahardjo (1997).
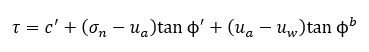
Furthermore, the unsaturated shear strength equation (Fredlund et al. 1978) was utilized to consider the contribution from the negative pore-water pressure during slope stability analysis.
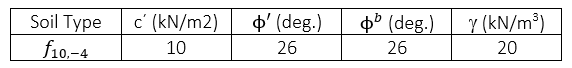
The material properties for the fine-grained sandy soil f10, - 4 are provided in Table 1. The SWCC and permeability function parameters for the soil are given in Table 2. Only the values for soil type f10, - 4 are necessary for this article.
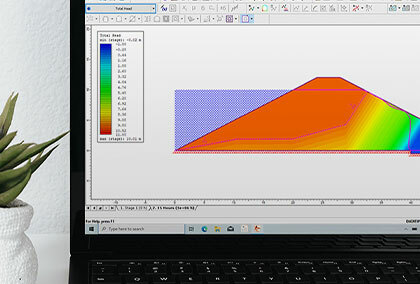
RS2 Results Comparison
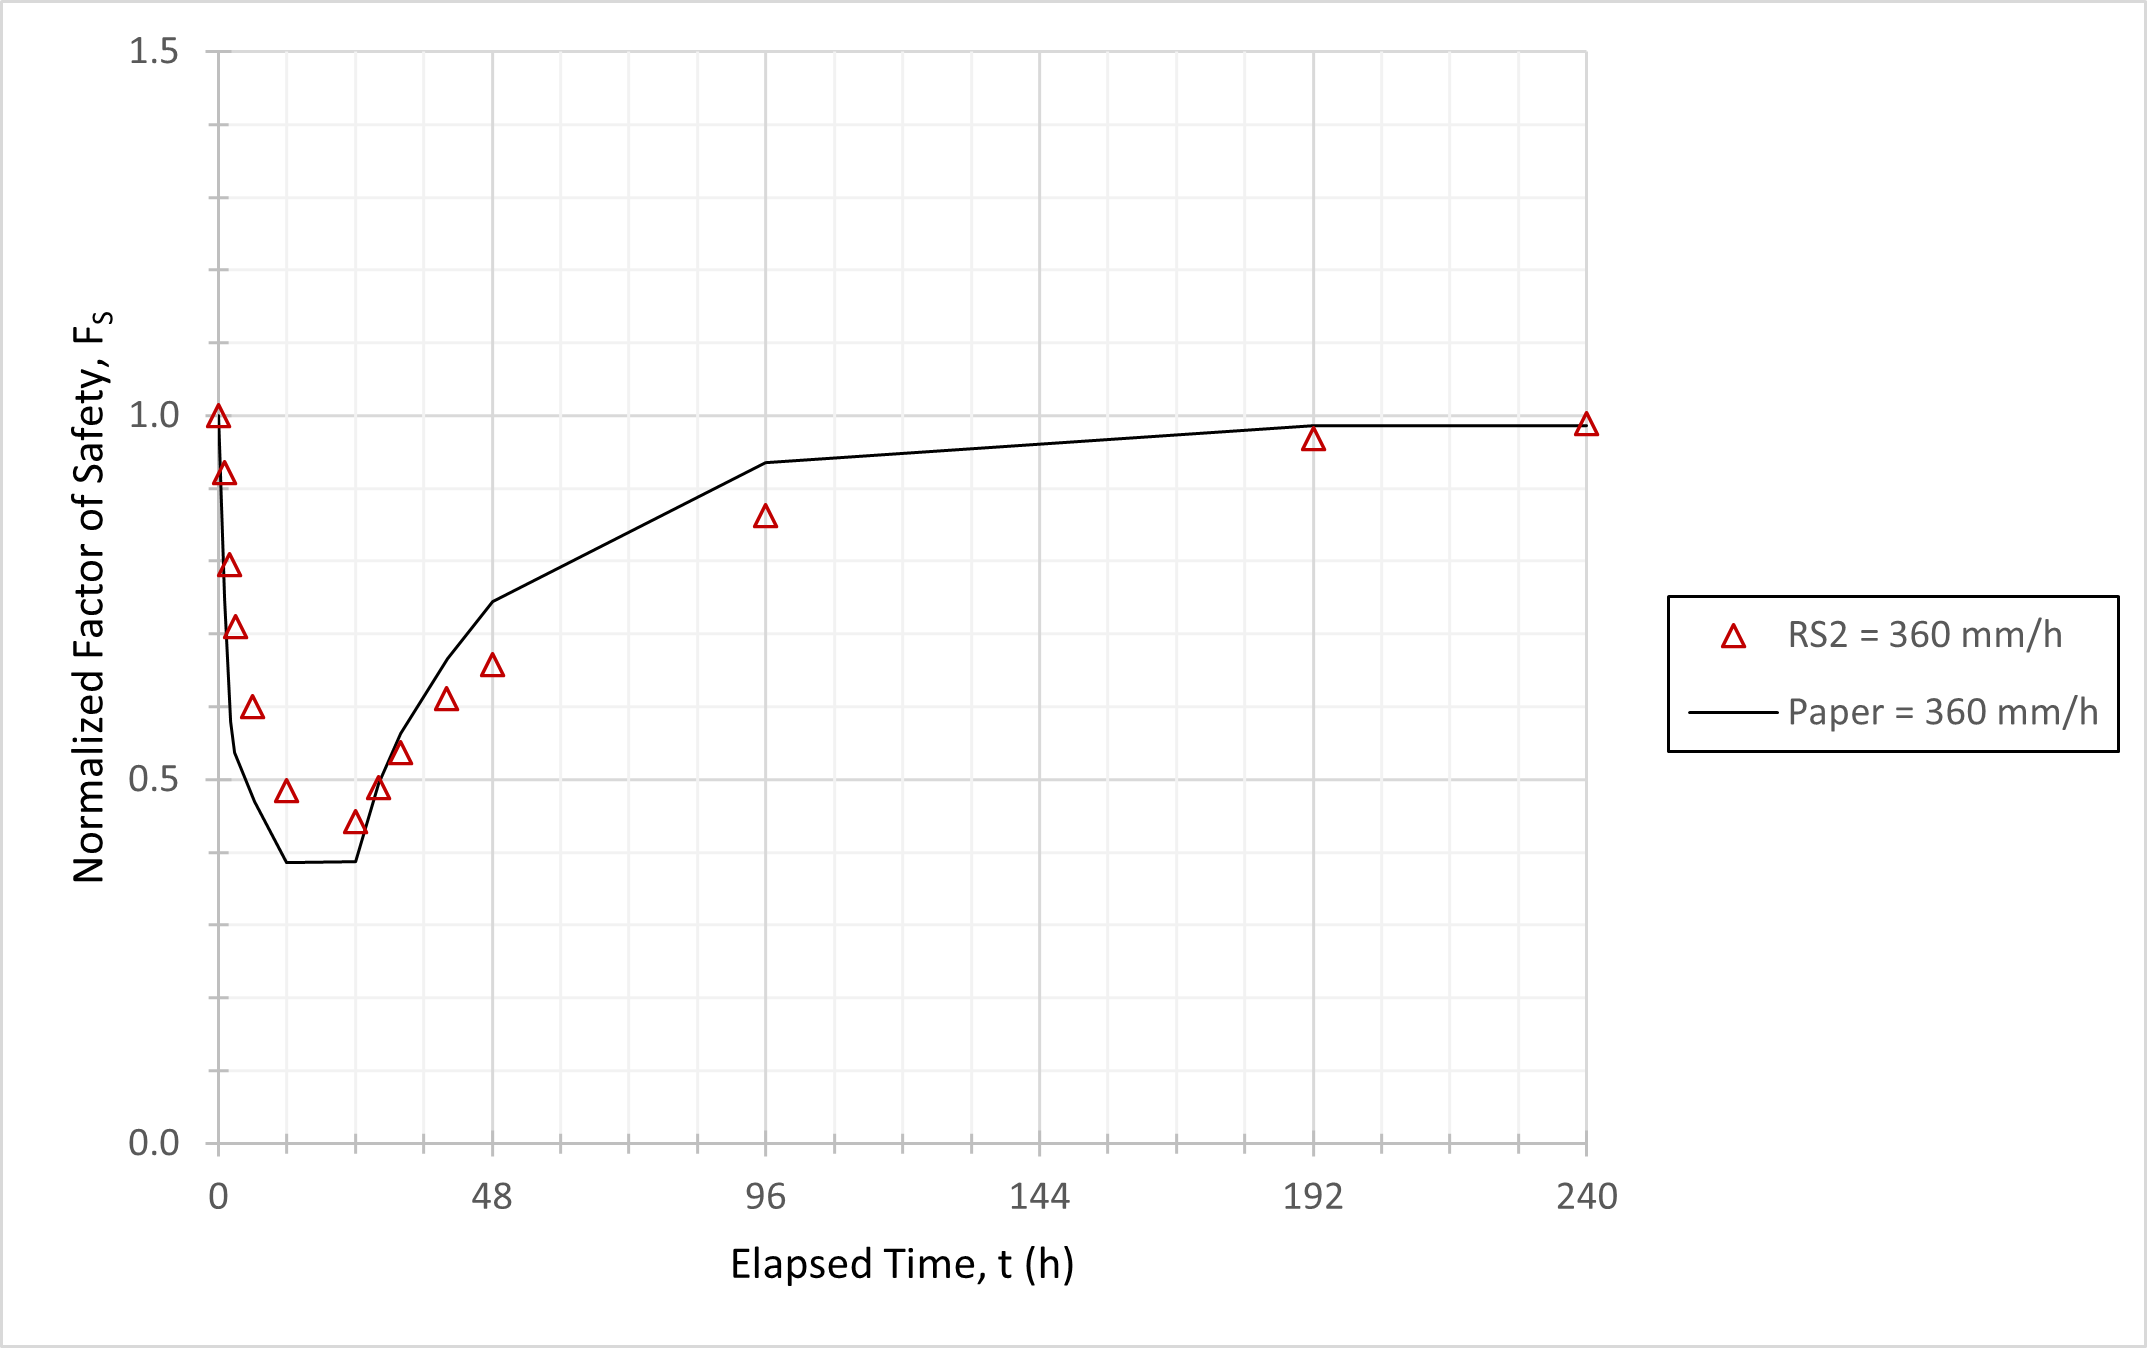
The parametric studies’ slope stability results were computed through SLOPE/W (from GeoSlope) with Bishop’s simplified method. The SRFs of both the paper and the RS2 results were normalized and plotted to compare the likeness of the data points. Based on the graphs, the RS2 computations for the intensity of 360 mm/h with soil type f10, - 4 were found to be the closest match to those of the parametric study. The normalized results can be seen in the graph below.
Note: The above parametric study is based on the paper by Rahardjo et al. (2007).