Latest Features in Slide3
Slide3 is a dynamic 3D Slope Stability Analysis program designed to overcome your most challenging problems. Slide3 can be used for a variety of applications including dams, retaining walls, open-pit mines, and more.
Stay up to date with the latest features and integrations that you can incorporate into your geotechnical projects.
January 2023
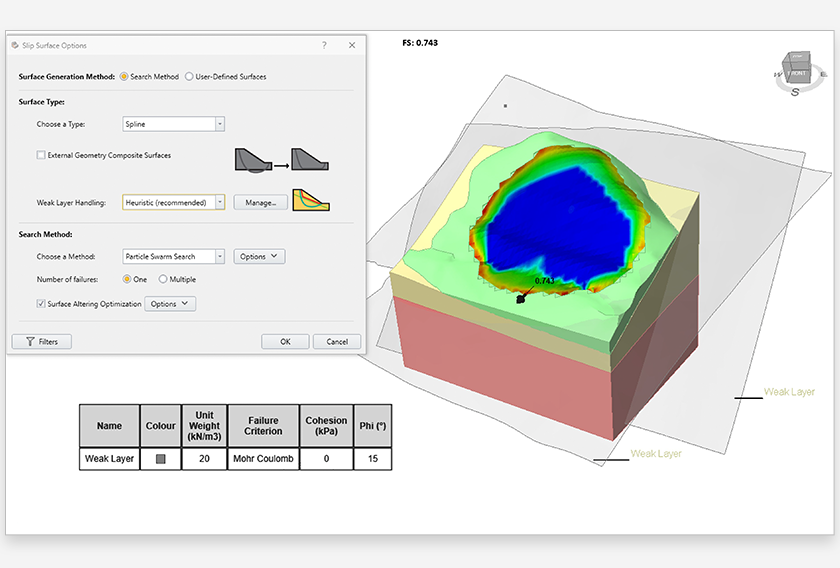
New Default Slip Surface Options in Slide3’s latest version
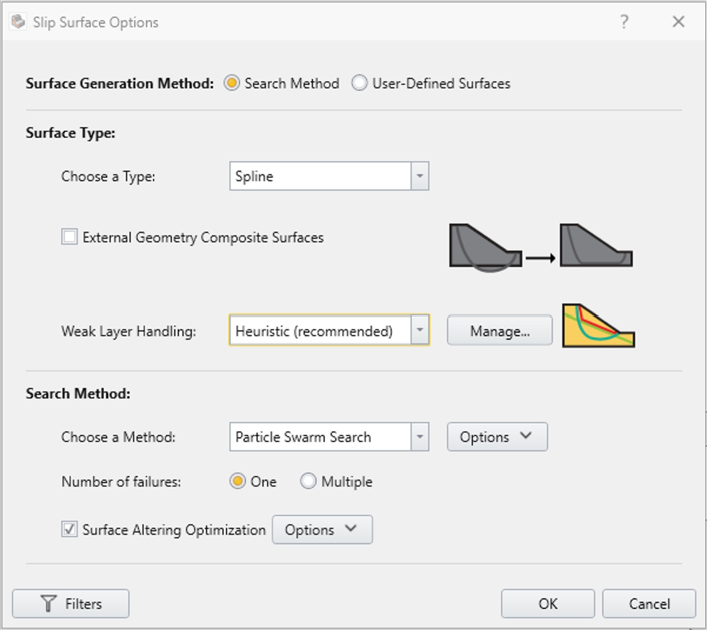
- Surface Type: Spline
- Global Search Method: Particle Swarm Optimization
- Weak Layer Handling Option: Heuristic
These new default options are optimized to work in conjunction with each other to speed up your workflow and provide more functionality to help you reliably find the critical factor of safety (FS).
Spline Surface Search Method
The introduction of the Spline Search Method provides yet another searching method to the list. Previously, you could use spheres, ellipsoids, wedges and multiplanar surfaces to search for a critical failure surface where the default option was ellipsoid. Now the Spline shape has been added which is much more flexible, being able to morph into many shapes.
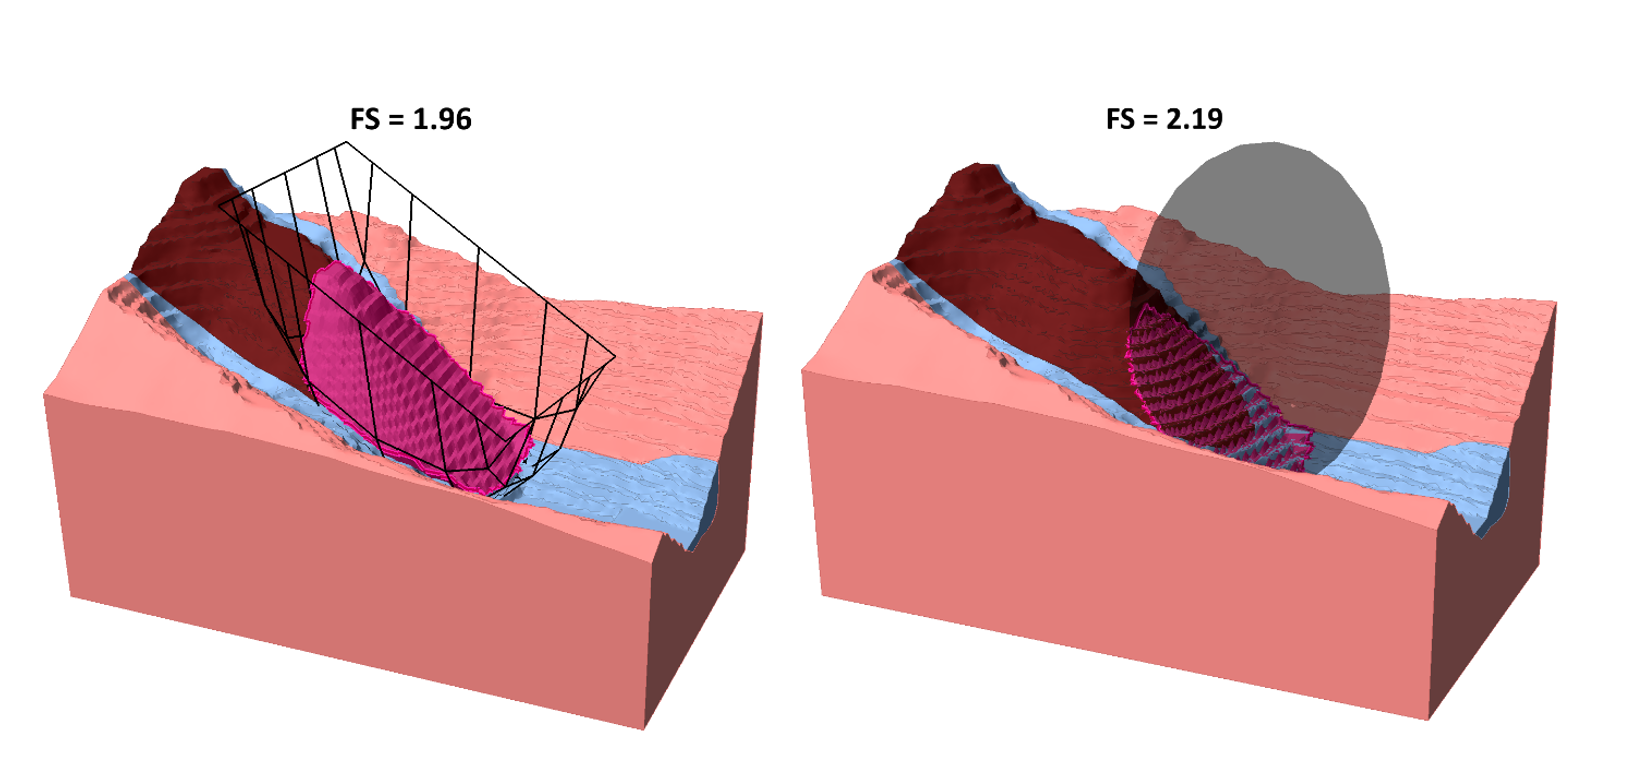
Through extensive testing, which used over 400 models from our validation and example models library, Spline Search was consistently found to be more reliable at finding lower FS values during the global search stage, compared to the previous default, ellipsoid.
Particle Swarm Optimization
Particle Swarm Optimization (PSO) is a swarm intelligence method which finds an optimal solution within the search space. One reason it’s becoming the new default search method over Cuckoo Search is because it runs faster given the same number of iterations and is compatible with the new Heuristic Weak Layer Handling.
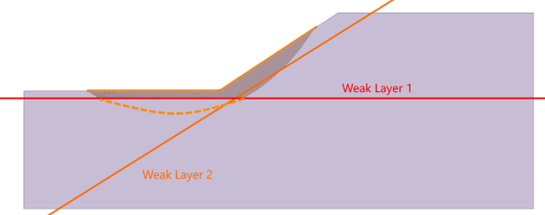
Heuristic Weak Layer Handling
Slide3 uses weak layers to cut slip surfaces during the search. Previously, you would select either “Automatic case generation” or “Always snap to the highest.” The previous default option “Automatic case generation”, being quite rigorous, can be computationally time consuming. On the other hand, “Always snap to the highest” feature although faster, does not always give the best answer. The new Heuristic Weak Layer Handling improves the computational speed compared to the previous default, all while maintaining the accuracy of searching.
The New Era of Slide3
Because the Spline Surface Search performs better with Particle Swarm Optimization, which performs best with Heuristic Weak Layer Handling, all three are becoming the new default options in Slide3’s latest version (3.021).
The purpose of this change is to provide you with the best possible combination of search method options to help you become more efficient and give you more options for finding the critical failure surface in your stability problems. Numerical modeling is never 100% accurate, but with these improvements, you’ll spend less time and come up with better results.
November 2021
What makes Slide3 so powerful is that it integrates seamlessly with several other Rocscience software such as Slide2 and RS3 – allowing users to perform in-depth, comprehensive analysis that wouldn't be possible through one program alone.
Building off the successful integration between Slide2 and RSPile, this feature was highly requested by users to be extended to 3D analysis. In response, Slide3’s list of integrations is now growing to include RSPile as users will have the ability to incorporate their piles from RSPile into their Slide3 analyses.
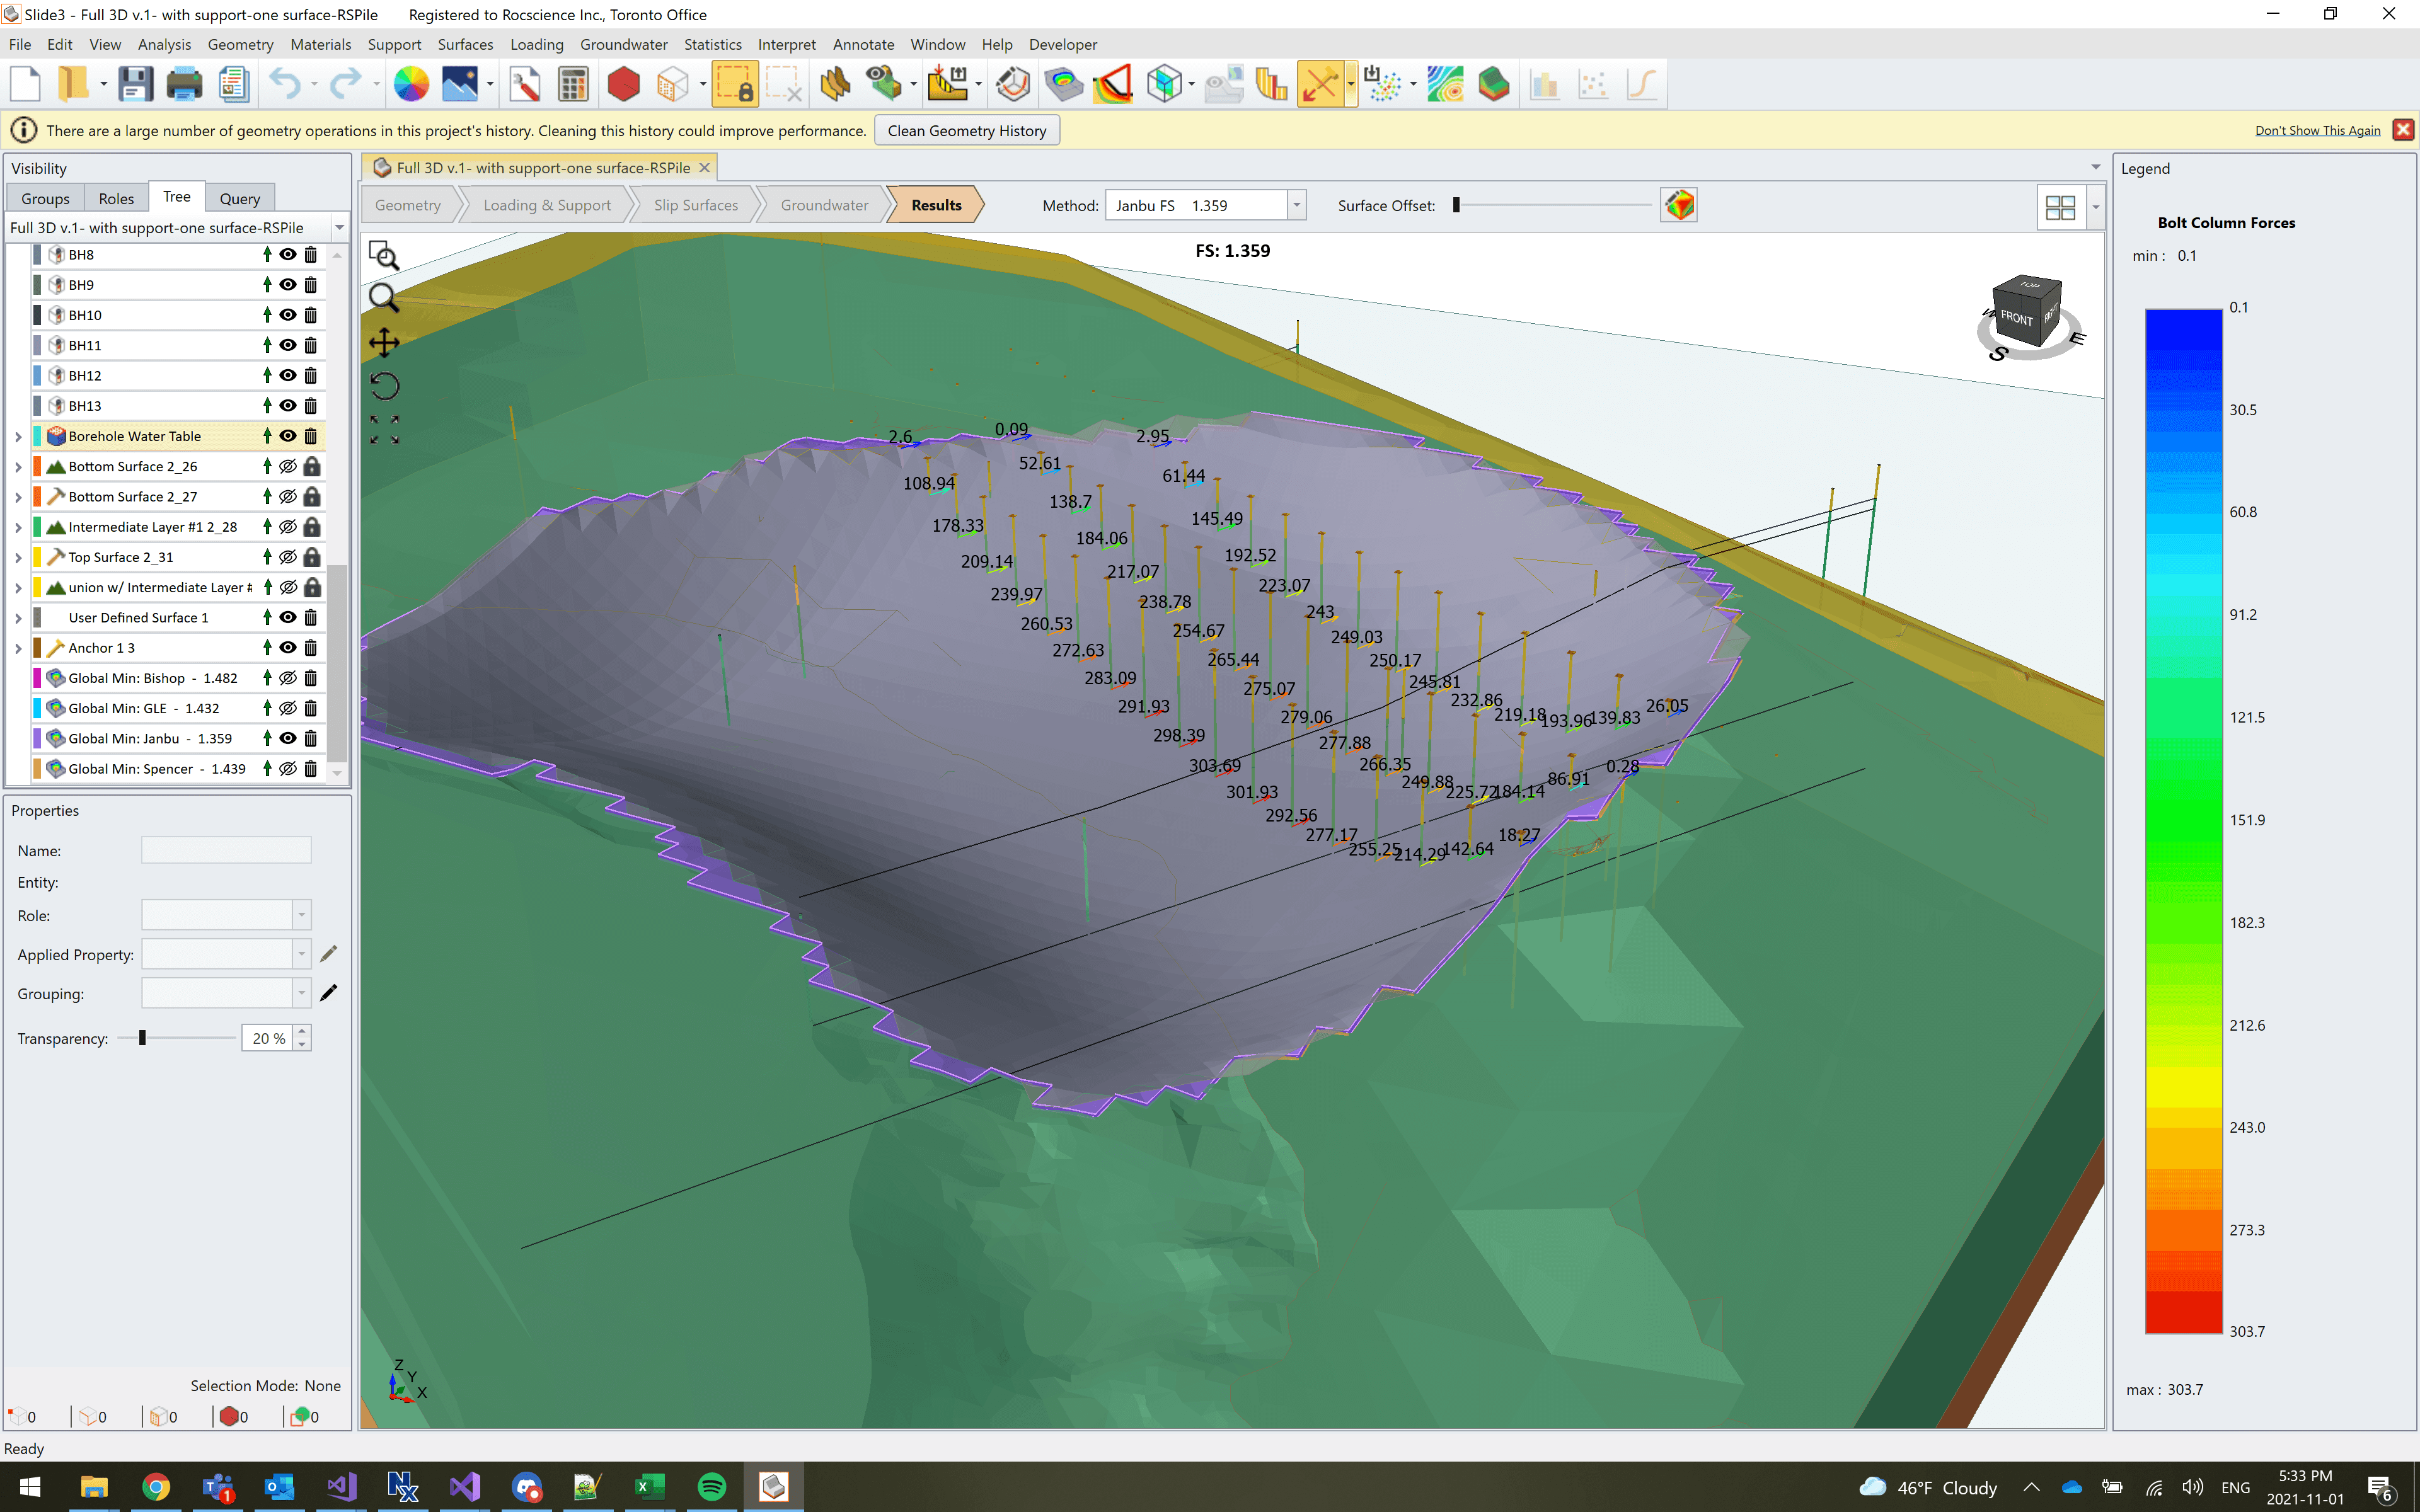
How it works
This first-of-its-kind integration allows you to use piles created in RSPile and add them into Slide3 as a Support Type. This can be done with either an existing RSPile file or by defining the pile and soil properties for a new file. During your computation, Slide3 will call on RSPile to perform pre-analysis of the piles in the model.
The pile properties defined in RSPile compute the mobilized lateral and/or axial resistance along the pile length for the given soil geometry and loading conditions. The pile support force is then determined in Slide3 by the location and angle of the slip surface intersecting with the pile. To achieve this, the properties for each material intersected by a pile must correspond with those in the Slide3 model.
This can be done through the Match RSPile Materials dialog box. During the analysis, the length of the pile and thickness of the soil layers in Slide3 will override those defined in the RSPile model, and the material properties defined in the RSPile model will be used for the computations.
February 2021
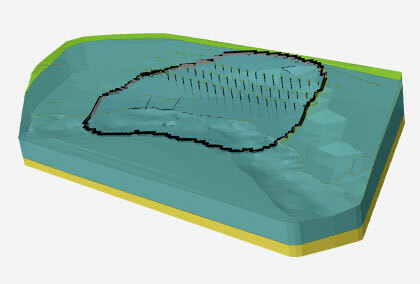
Block Model Import into Slide3
One feature highly requested by our users is the ability to import Block Models into Slide3.
Block models are an integral part of mine design and planning. Modern-day software allows mining engineers to generate huge point clouds of data to provide insight into the mine’s geological properties. Every “block” that gets mapped represents an area of rock labeled with specific material data like rock type, density, etc. This information is generated by exploratory drilling. The mapping of block models improves the efficiency and accuracy of prospecting new mining locations by creating a 3D map of the underground material.
The point data that makeup block models gets stored in data tables, which depending on the size of the mine can be quite large and complex. To analyze these block models, a model would need to be built from scratch in a slope analysis program using the point data which can be a time-consuming task.
Our team of developers worked with industry partners to create this new integration feature allowing you to import block models from spreadsheets or .csv files directly into Slide3 for stability analysis.
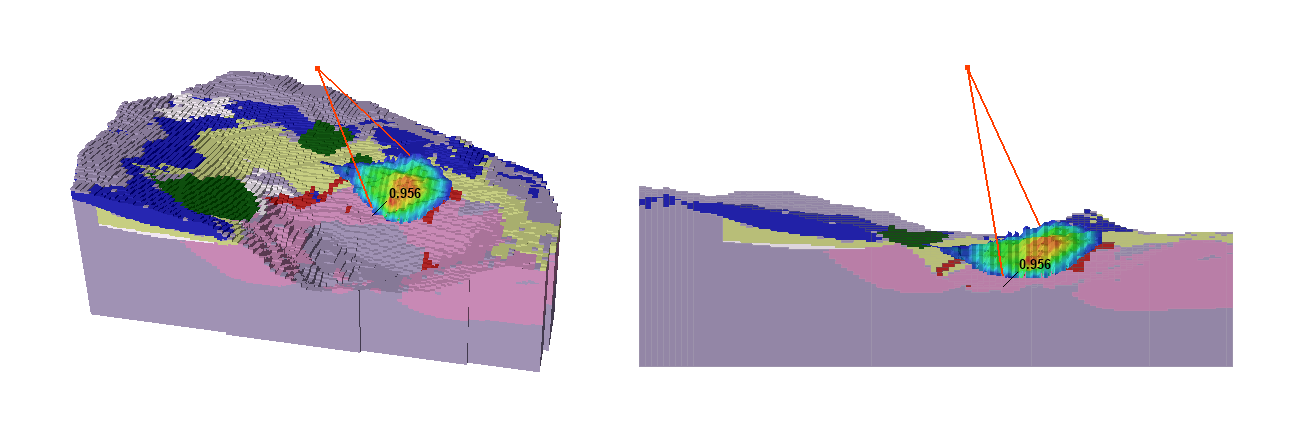
Figure 1: Slide3 Analysis of a Block Model for an Open Pit
With the new Maintenance+ update, Slide3 will have the ability to import block models generated in Leapfrog, Deswik, Vulcan, Datamine as well as other programs. Once the block model is imported, you can analyze the factor of safety in the same way as any other model.
Design Standards
We understand it can be time-consuming to manually change specific factors to ensure your models satisfy different design standards. Normally, users must specify custom factors and properties according to each design standard before running their analyses. Now in Slide3, you can select a specific design standard, and the variables will change automatically for you, streamlining your workflow. With numerous design standards being implemented, comparing results is now faster.
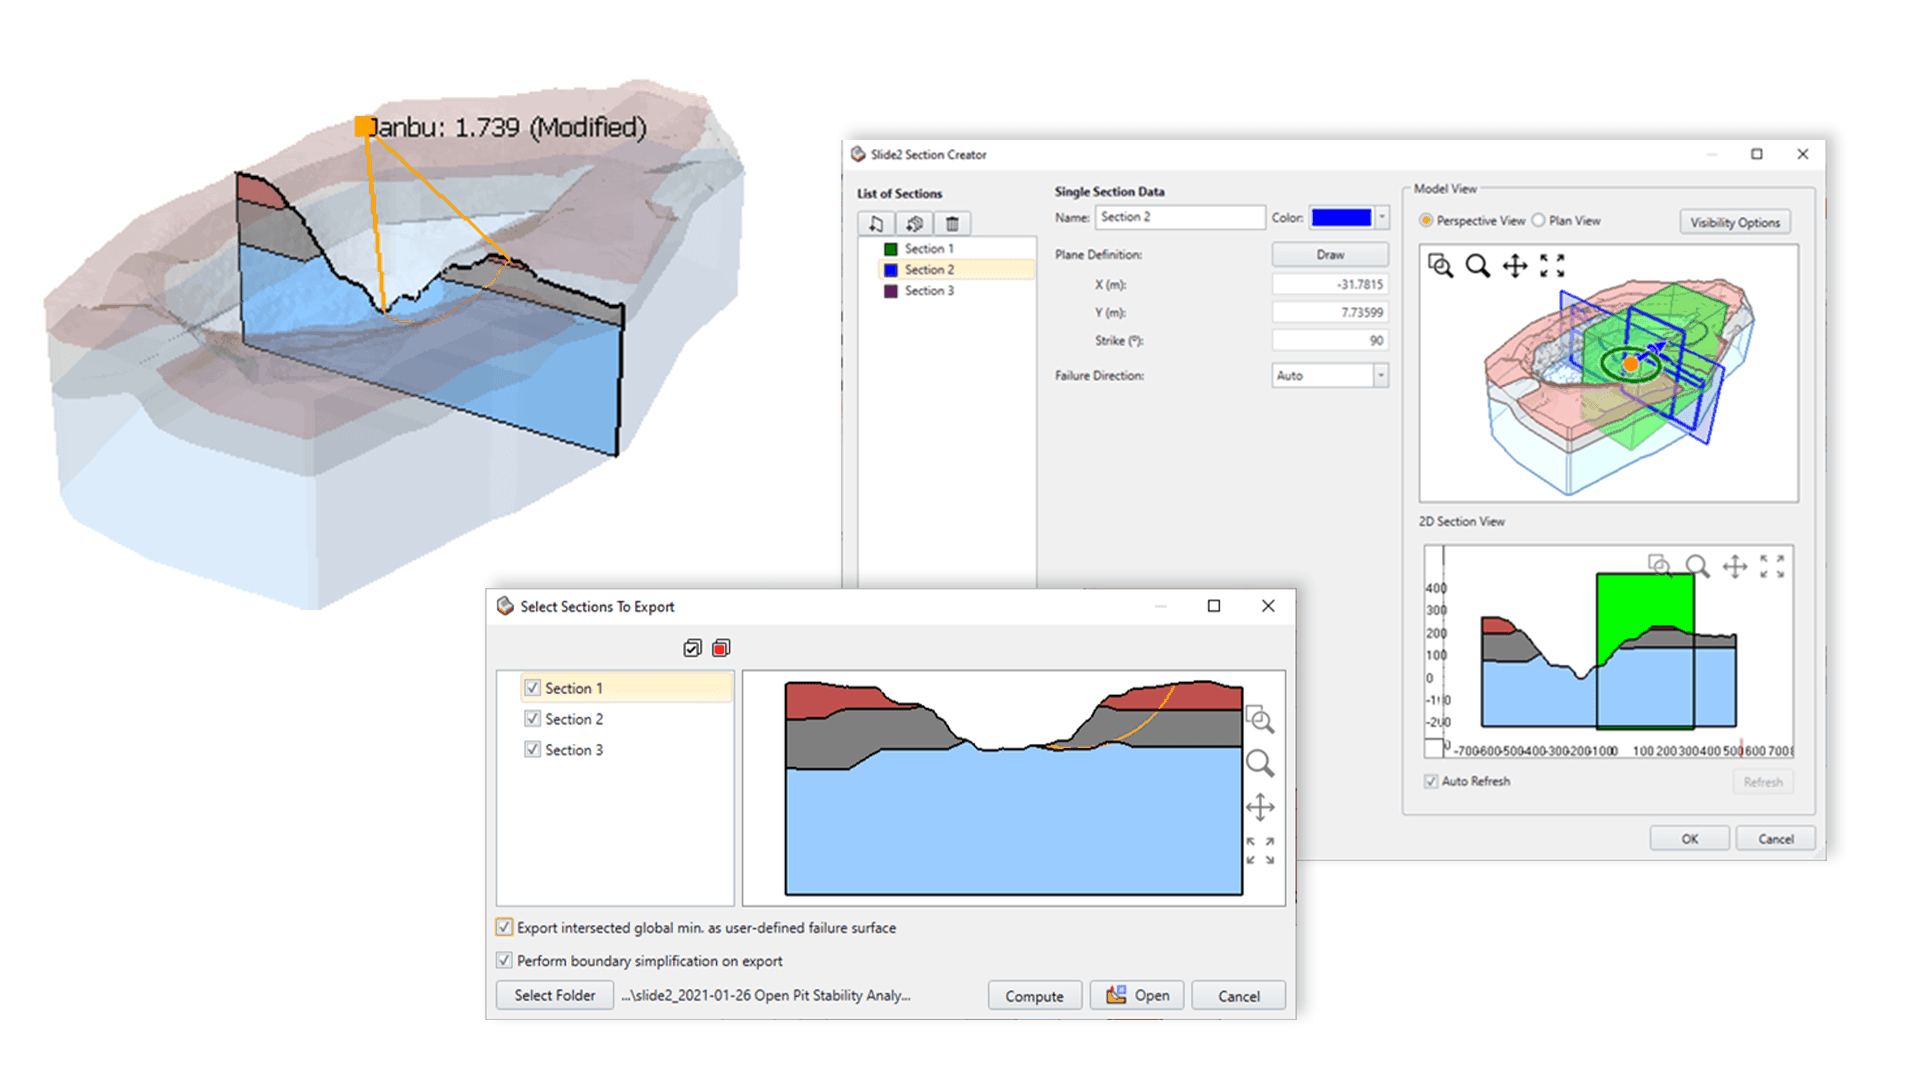
2D Section Analysis
Also being implemented into the next release of Slide3 are improvements for viewing Slide2 sections. You will find more visibility options for viewing your 2D cuts in the Slide2 Section Creator dialog. You will also be able to adjust search settings and create user-defined surfaces prior to computing.
September 2020
Multi-Modal Optimization (MMO)
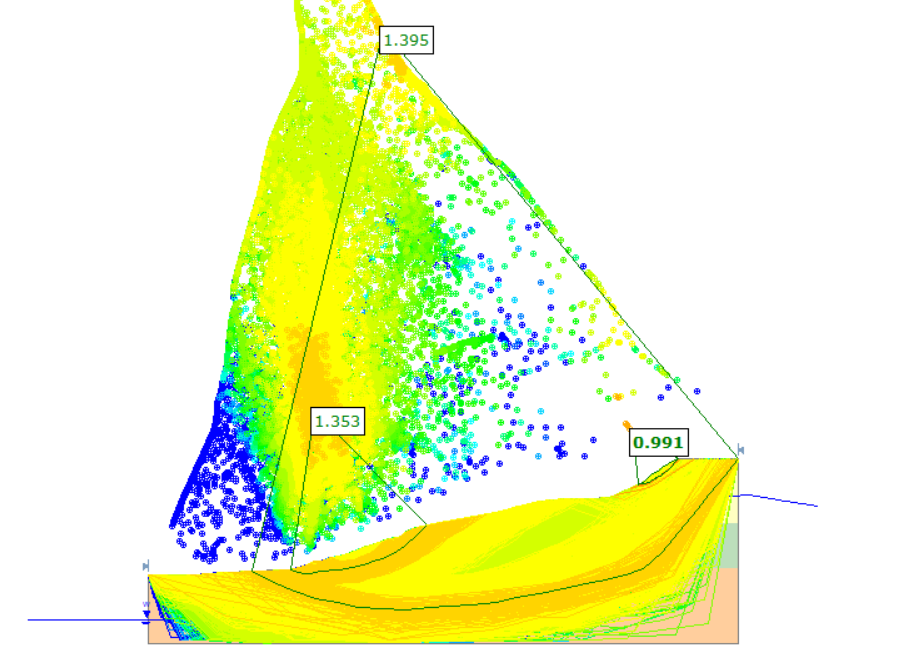
The Multi-Modal Optimization feature was introduced to help address some of the real-world complexities of analyzing a slope. Slope stability analyses generally focus on the search for the single global minimum surface. Yet in reality, a slope will often have multiple critical regions that may fail, instead of a single critical region. This is where MMO comes into play.
With the Multiple min option, the user can now let the algorithm search for multiple local mins instead of the single critical one – this is called multi-modal PSO. The parameter of note is the “radius span of search space.” The number of local mins found will be equivalent to the number of particles in the search (default 50 particles). As such many of these will be very similar. The radius option filters out the surfaces that are similar and only take the most critical local minima in each region.
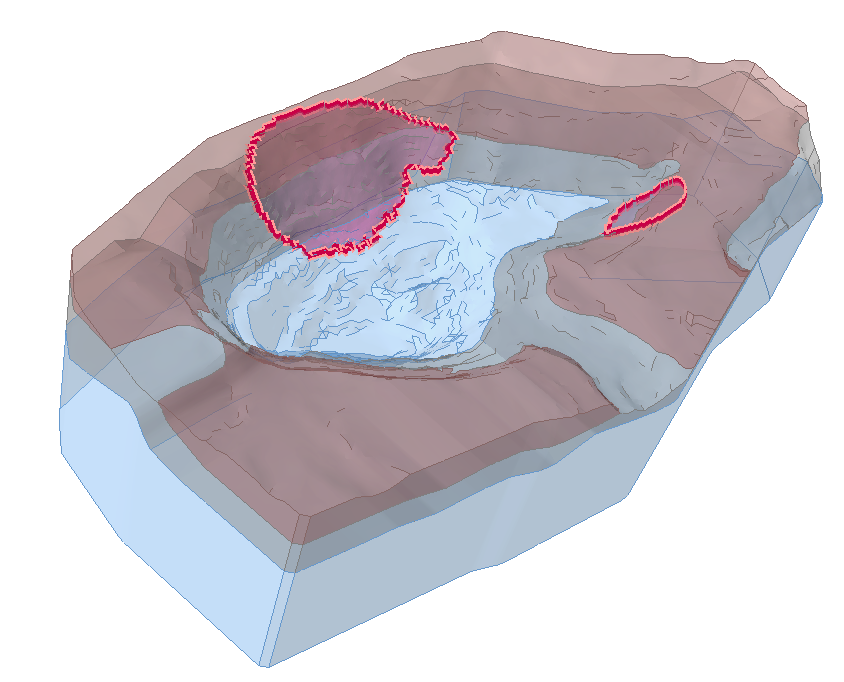
Added Weak Layer Algorithm
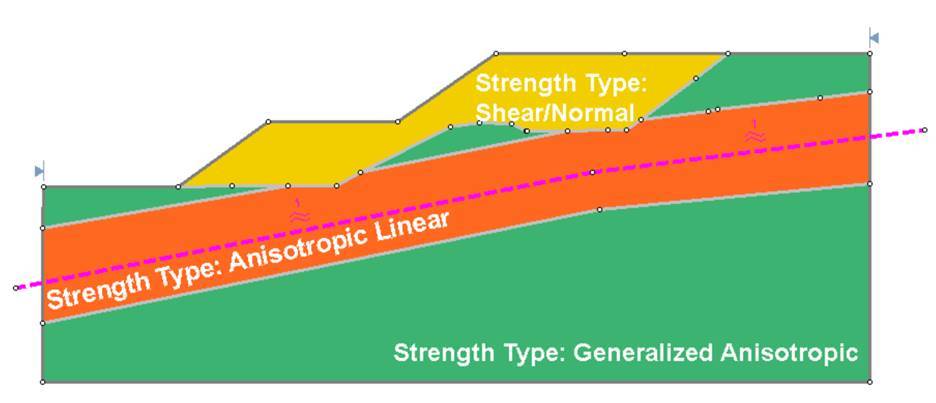
The Weak Layer option in the two Slide programs allows users to define a weak layer using only a polyline with assigned strength properties. Since a weak layer polyline has no physical thickness, it is intended to be used for modeling interfaces, joints, or very thin weak layers with negligible thickness, along which sliding could occur.
A new algorithm has been introduced for this feature to address cases where there may be multiple weak layers that overlap in the model. Sometimes, the material beneath a weak layer can be weaker than the weak layer itself. Thus, the Weak Layer Handling feature has been added. When the Weak Layer Handling feature is enabled, Slide can determine which configuration of weak layers produces the most critical slip surfaces.
Defining Probabilistic Shear Strength using Coefficient of Variation (COV)
Previously, when performing a probabilistic analysis in Slide2 and Slide3, a user would define the soil using parameters such as cohesion and friction angle. They would enter a mean value as well as a range for that value to be considered. For users that don't have sufficient data on how much cohesion and friction angle (for example) might vary, a new feature has been introduced to allow the user to define the probabilistic shear strength using the Coefficient of Variation (COV).
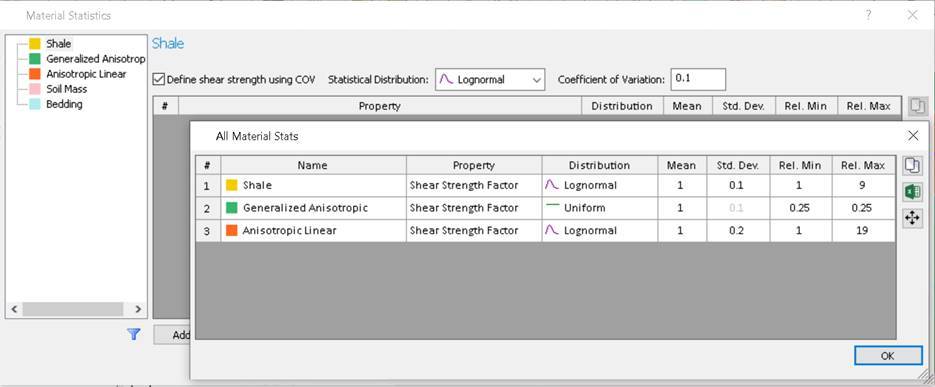
With COV, the strength for each strength type is calculated with an equation based on the input parameters, which can make things much simpler for users. This also means users can now do probabilistic analyses for all strength types (shear/normal, anisotropic, etc.)
Even More Features
If all these new tools weren’t enough, users will be excited to hear that Slide2 is continuing to expand its library of available manufacturers for Common Support types. This easy to use, built-in feature allows users to select specific support products from a list of manufacturers, to make designing and analyzing support solutions easier. This next update to Slide2 will include the additions of Wavin and Williams Form Engineering, who bring a wide range of geogrids, geotextiles, anchors, and soil nail options.
May 2020
Radar Monitoring of Slopes
Synthetic aperture radar (SAR) monitoring is a tool used for both broad-scale strategic monitoring and tactical-focus monitoring to determine progressive (accelerating) slope movement which can indicate impending slope failure.
SAR monitoring works by using a broad fan-beam to illuminate the same target multiple times within the same scan. For each pixel of a SAR image, a phase value is measured along the line-of-sight by the radar. By comparing phase differences of subsequent scans, it is possible to detect small variations that relate to sub-millimetre deformations of the slope.
This radar data can be easily imported into programs like Slide3 and RS3 and overlaid over models of predicted slope behaviour.
March 2020
Report Generator
This spring, Rocscience is excited to announce the introduction of the Report Generator, a dynamic new reporting tool coming to some of Rocscience's most powerful programs, including Slide2 & Slide3, RS2 & RS3, and EX3. Formerly called the Info Viewer, this new reporting tool lets you create sleek, professional-looking reports for your geotechnical project.
When you launch the Report Generator it will automatically create a report of your analysis, and package it with a customizable cover page, table of contents, headers and footers, and so much more.
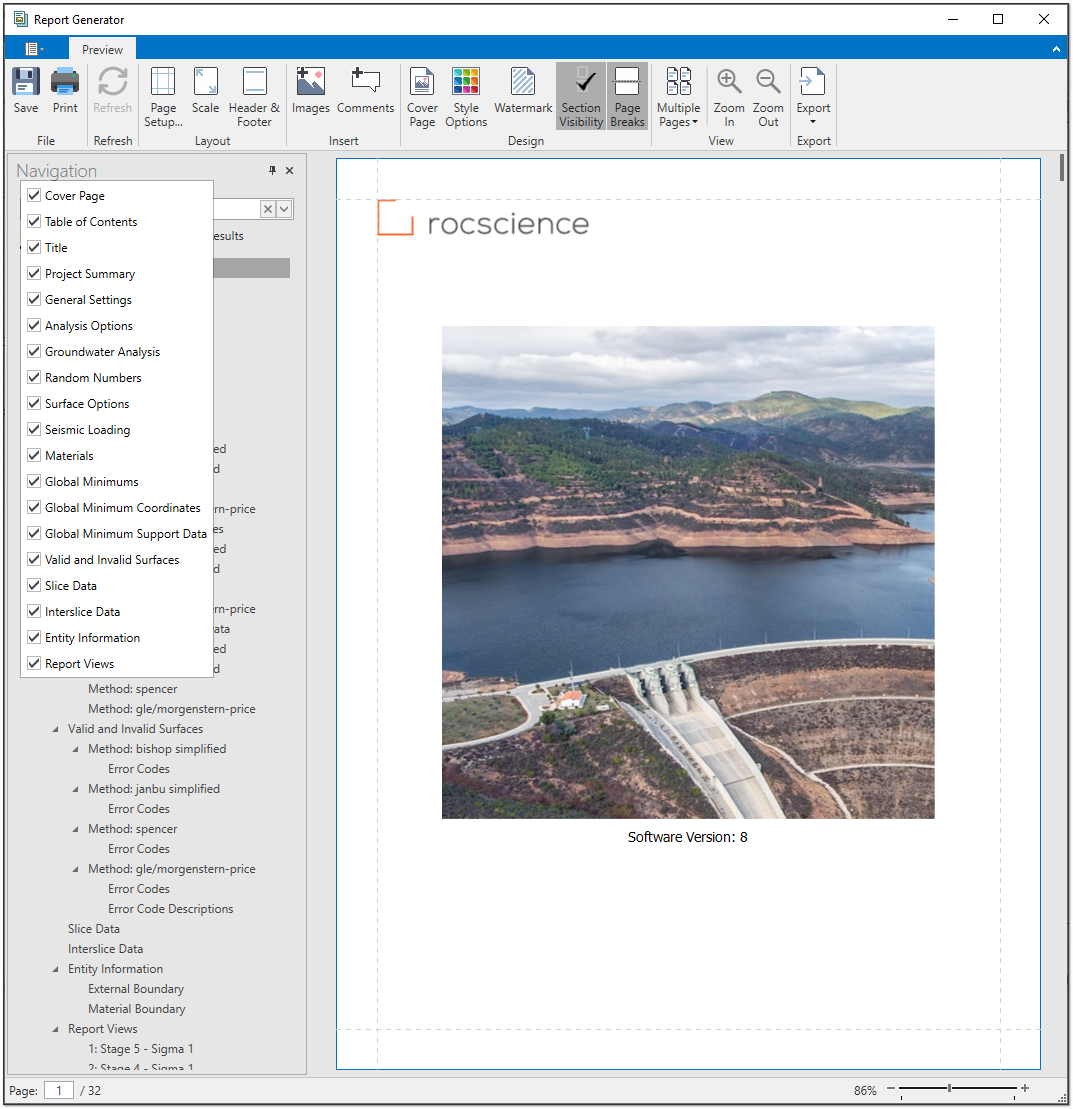
The Report Generator includes a navigation bar that lets you quickly navigate and search the report. Just click on the document map to view sections of the report or use the search bar to look for specific content. Included in the report is a table of contents that is automatically created and adjusted as you add and remove sections from your analysis.
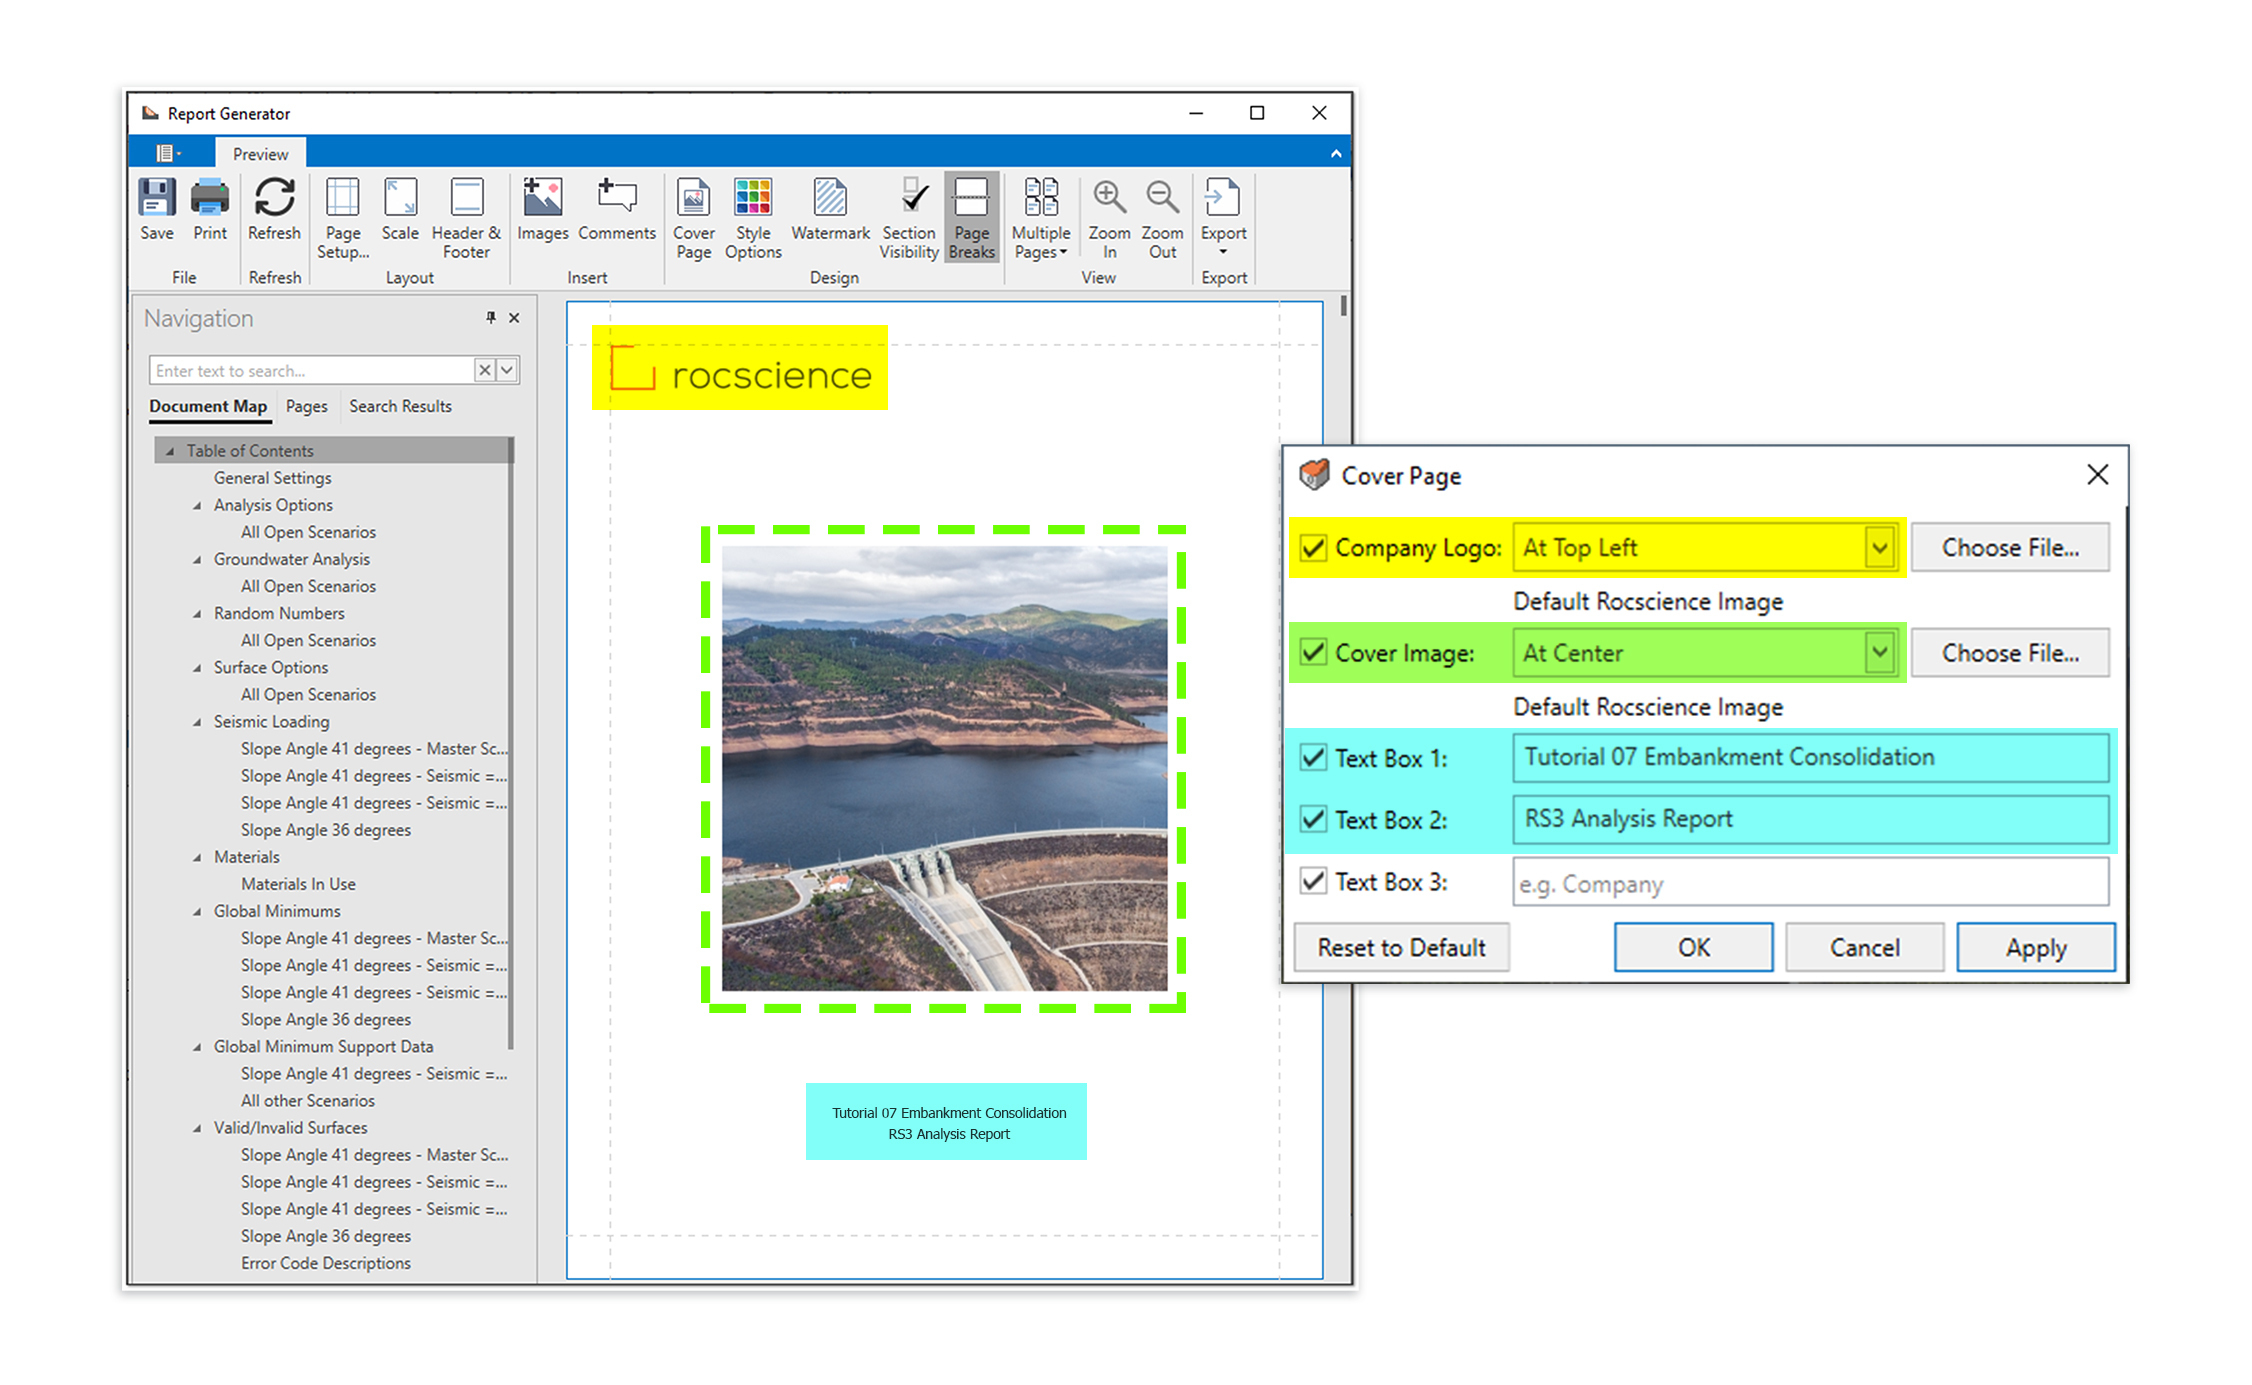
A sleek, editable cover page is automatically created for your report and can be customized with your own images, company logo, and more. Use the controls to easily adjust the layout and select what sections to include. Once you’re happy with the look of your cover page, you can save time by saving these customizations for use on future projects.
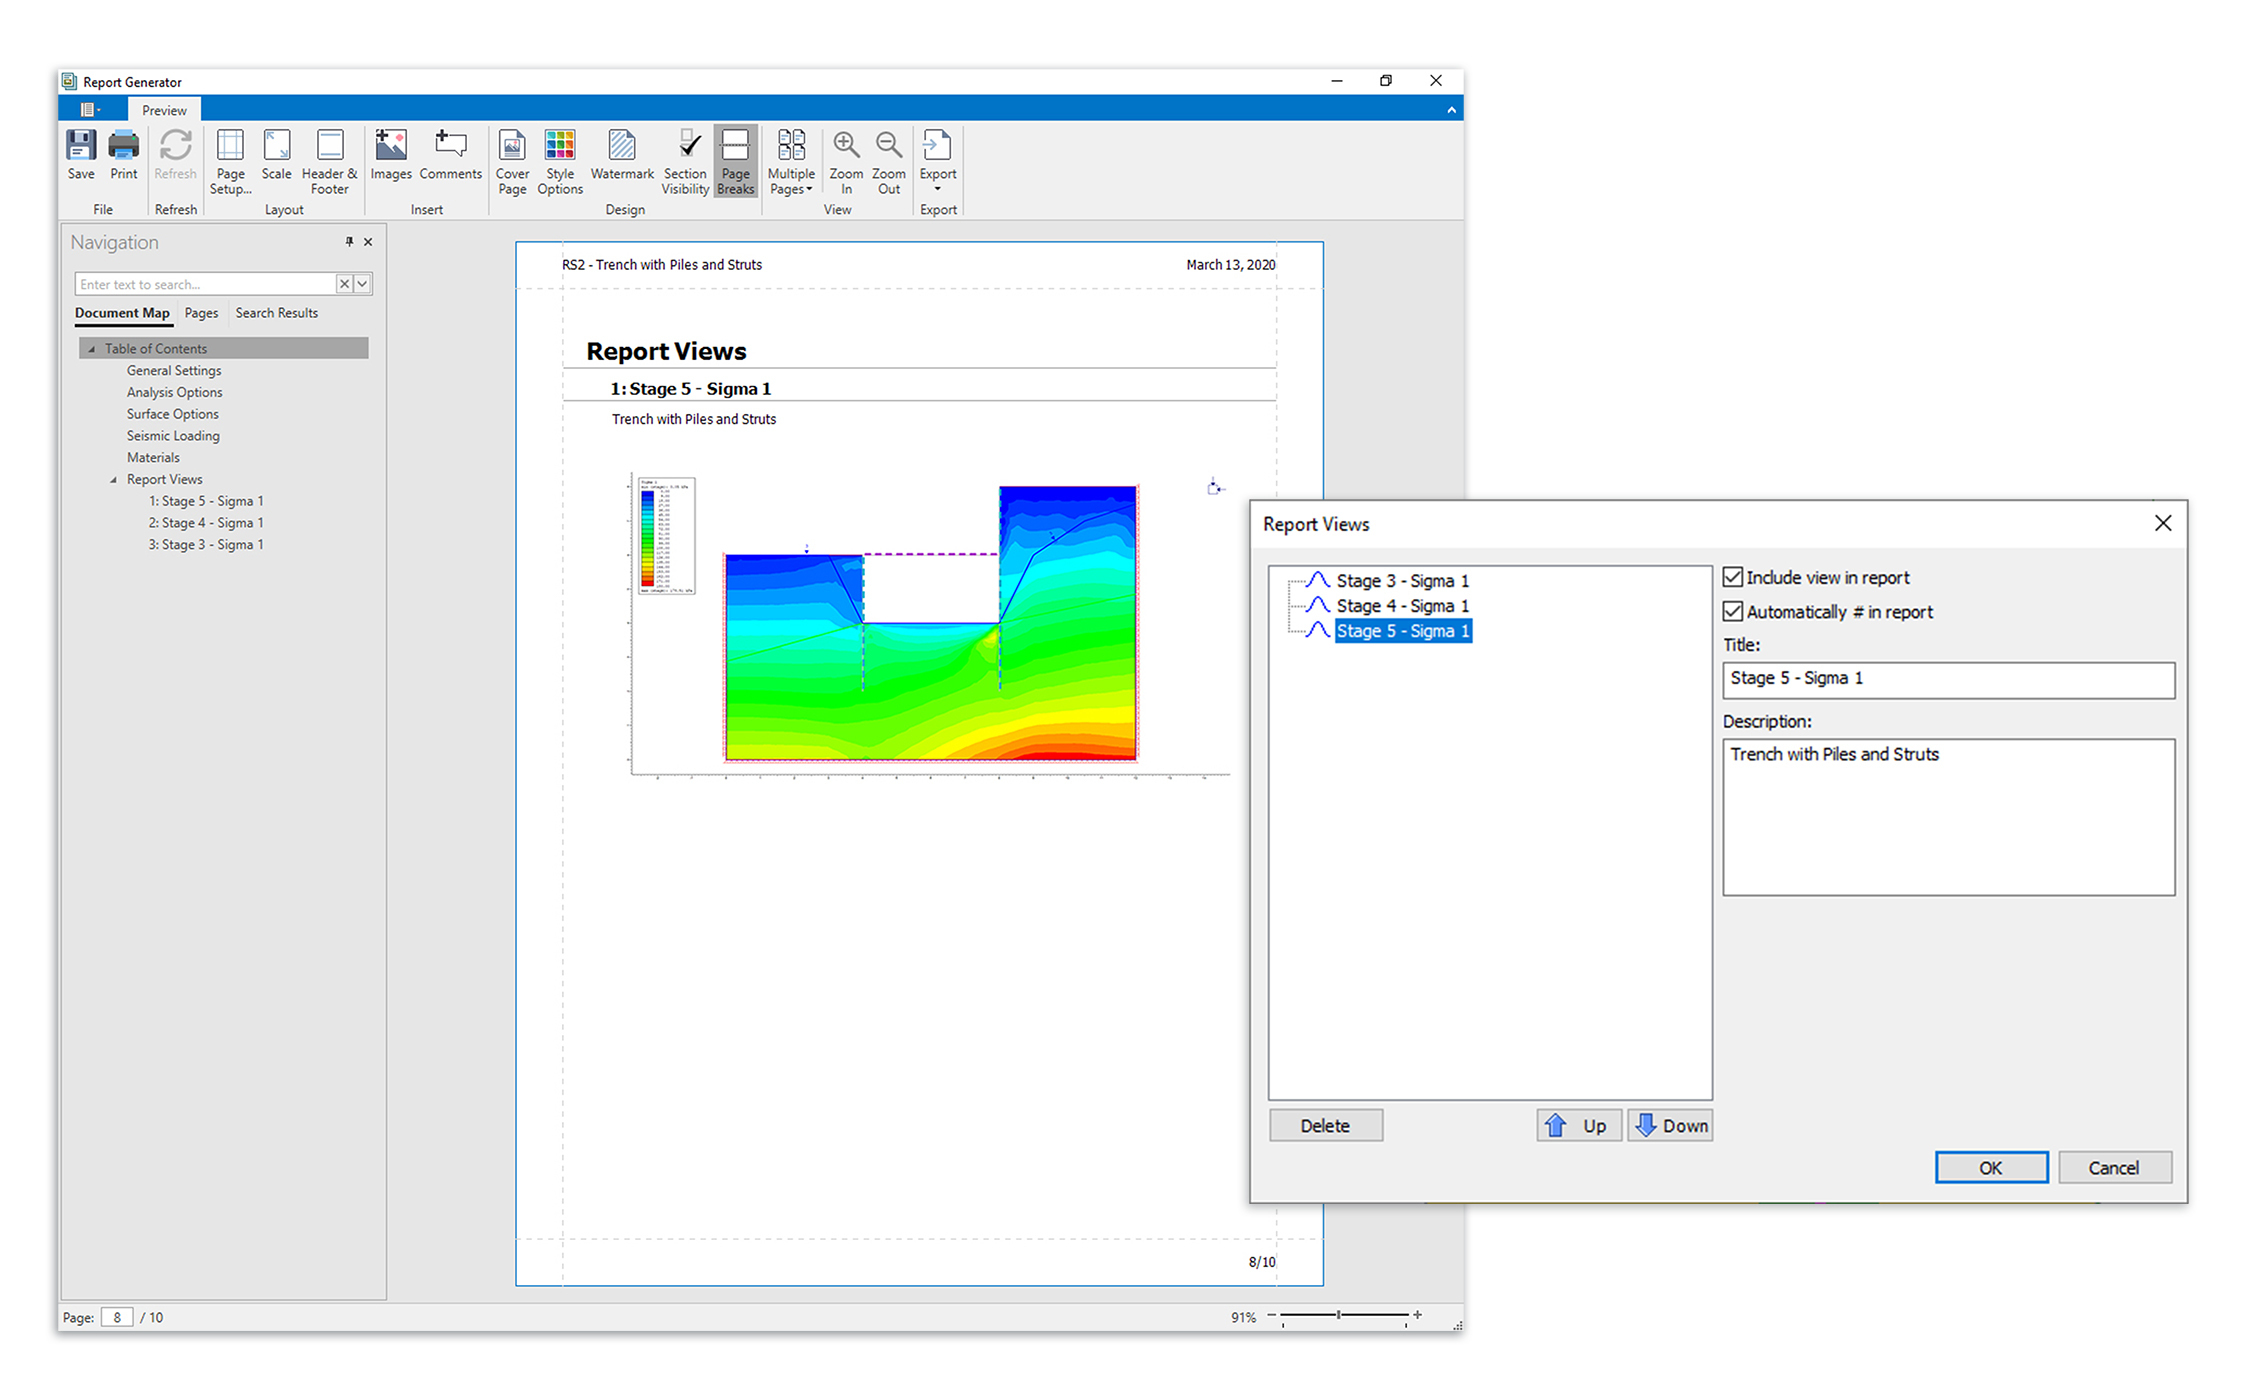
With the Report Generator, you can edit more than just the look of your report though. You can also add content of your own! Use the Add Images or Add Comments buttons to add text and images to any section of the report. If you want to add snapshots of the computed model, you can do that as well from the Interpret window of your Rocscience program. The tool lets you add multiple views of your model, add titles and descriptions, and even arrange the order of the views. The views of the model will then be added to the end of your report.
Once you’re done customizing your report, you can easily print or export the file.
December 2019
Simplify Geometry Triangulation Feature
New in both RS3 and Slide3 is a Simplify Geometry Triangulation option that allows users to simplify the triangulation of selected imported geometry to reduce the number of triangles. The option is available as a standalone function on the Geometry > Surface Triangulation Tools menu or as part of the Import Geometry process. When selecting the tool, the Simplify Triangulation dialog appears with options for applying a Simplification Scheme and Simplification Level.
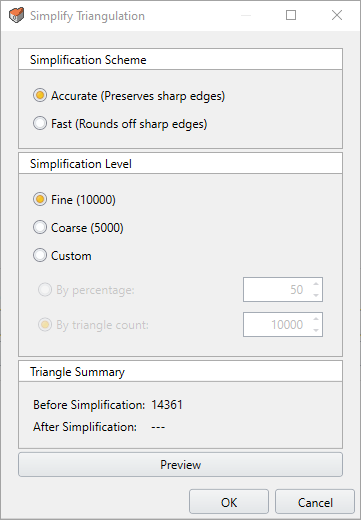
This new tool is an outstanding addition to the already impressive array of Surface Triangulation Tools available in RS3 and Slide3 to edit model geometry
Enhanced Post-Processing Step During Geometry Import
The Import Geometry process in RS3 and Slide3 has been enhanced with the incorporation of the validation and cleaning operations into a single Post-Processing Step as the last step in the process. Together with the addition of Geometry Simplification (see above), this enhancement makes this powerful tool even easier to use.
Added Surface Triangulation Tools
In addition, to Simplify Triangulation, several other surface tools have been added to the Surface Triangulation Tools array in RS3 and Slide3. These include:
Convex Hull creates a surface that envelops the selected geometries, i.e., a bubble that encloses all selected surfaces/lines/points. This can be used to recreate simplified slopes or ore bodies that were stored as unstructured triangle slopes.
Add Surface from Points creates a terrain-like surface from the vertices in imported or selected geometries (other surfaces, lines, and points). This is a common feature in 3D CAD tools that have 3D scans stored as point clouds for surface reconstruction.
Add Surface from Existing Contours creates a terrain-like surface from a set of lines. This is a common feature in 3D CAD tools that have 3D scans stored as elevation contours for surface reconstruction.
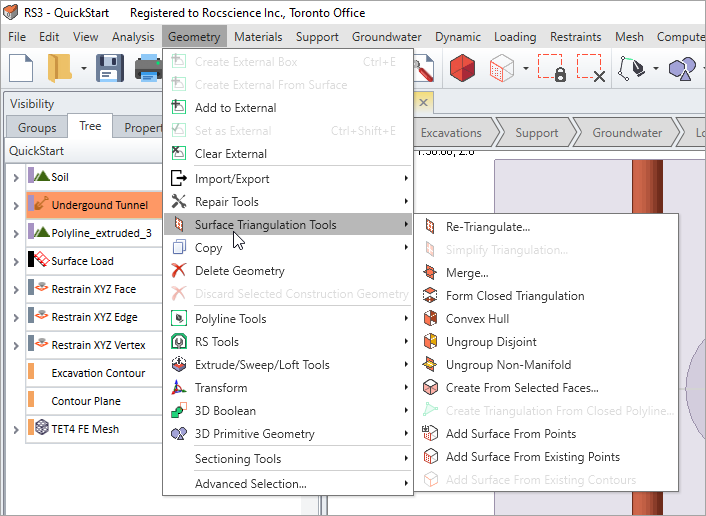
All three new tools have been added in response to user feedback we’ve received requesting help in creating or reconstructing shapes in 3D.
More Geometry Repair Tools
Two new tools have been added to the Geometry Repair Tools in both RS3 and Slide3 to assist users to do overall cleaning of the model. These are:
Collapse Material Boundaries is a convenience function that gives users the ability to “union” adjacent solids that have the same material assignment over all stages in a project. From experience, unnecessary splits can occur to a unified solid that breaks up into small pieces. This increases the complexity of the model and reduces the speed of simulation. In previous versions, users could already clean up the model by manually selecting the pieces one by one and “unioning” them, but this can be tedious. Users can now simply use this function to have the program quickly merge all touching solids that have the same material assignments over all stages.
Discard Isolated External Pieces make suggestions and removes floating solid pieces that are disconnected from the rest of the model.
Export of Contour Surfaces
New in both RS3 and Slide3 is the ability to export selected contour surfaces to a file. The new feature is available by selecting Export Contour Surface on the Interpret menu and will be useful to users who want to import contour surface information into other 3D geometry or data programs for further analysis.
Import of IDS Live Radar Data to RS3 and Slide3
Newly added to both RS3 and Slide3 is the ability to import live IDS radar monitoring data for contouring on the existing model. In previous versions of the program, users could import radar data from a CSV file. The difference now is that users can establish a direct live connection to a data server using a REST API. This addition of support for live radar data means Rocscience is one step closer to so-called intelligent slope design.
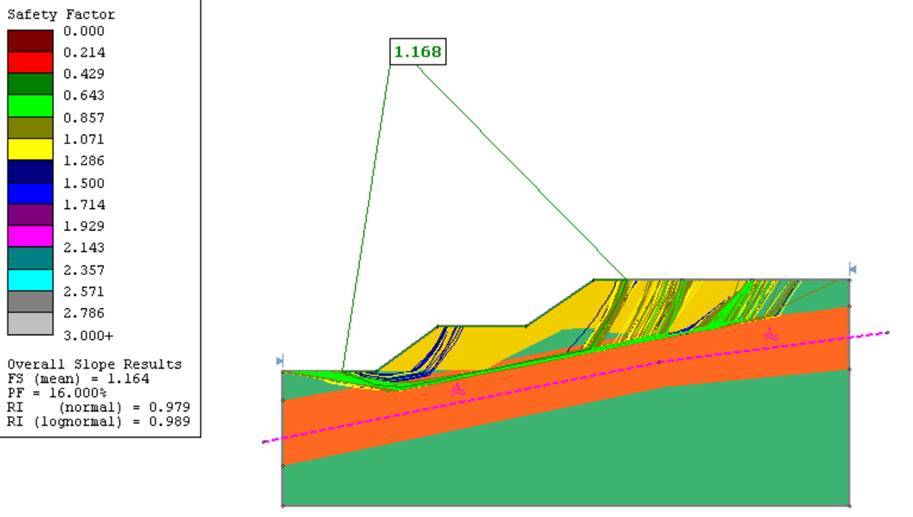
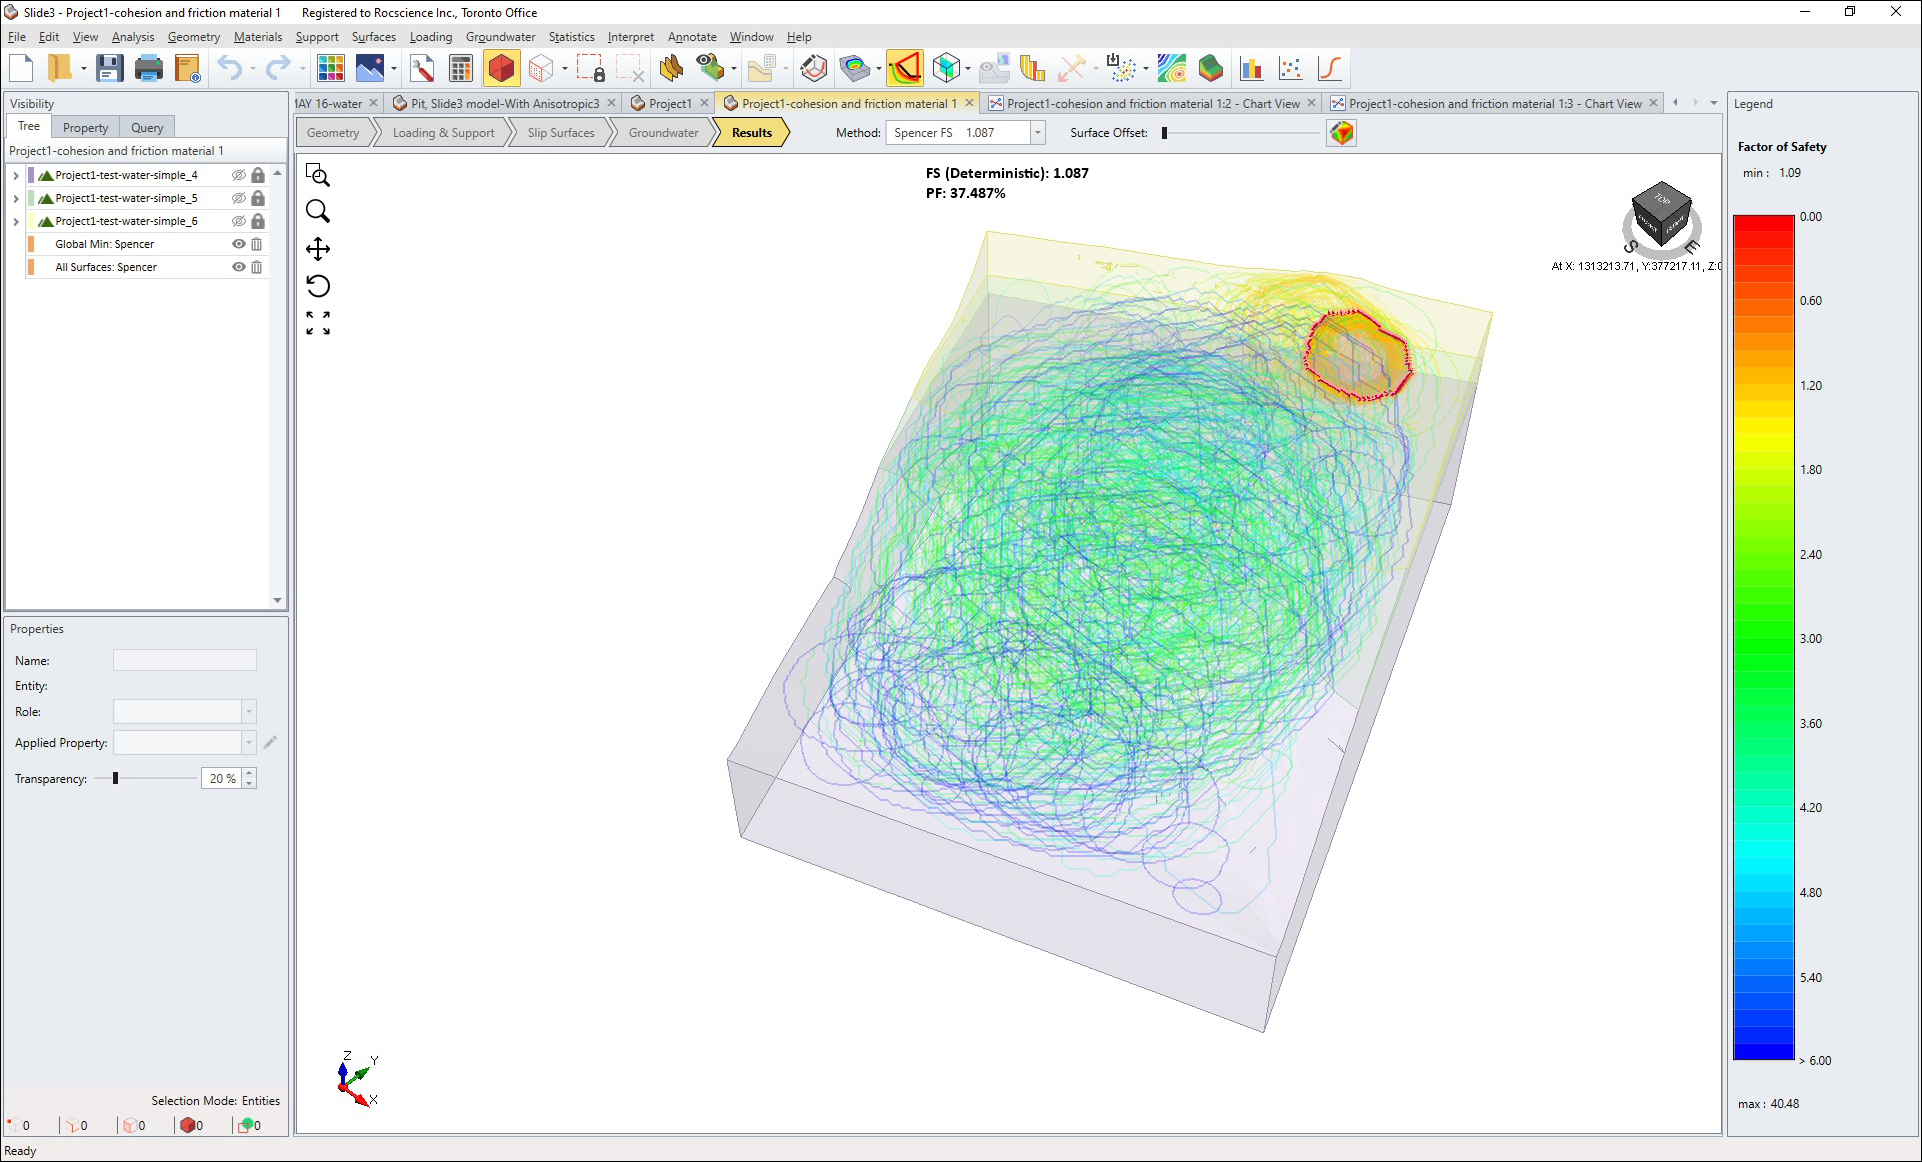
Probabilistic Analysis in Slide3
A major new feature in Slide3 is the ability to perform a Probabilistic Slope Stability Analysis to determine the effect of uncertainty or variability of input parameters on the results of the slope stability analysis.
For most real-world slope stability problems, the values of many input parameters are not very well known, therefore a probabilistic approach to the analysis of slope stability can be useful. In a probabilistic slope stability analysis, the user may assign statistical distributions to material properties.
By assigning a statistical distribution to one or more model input parameters, the user can account for the degree of uncertainty in the value of the parameters. Input data samples are randomly generated based on the user-defined statistical distributions. A given slip surface may then have many different Factor of Safety values calculated. This results in a distribution of Factors of Safety from which a Probability of Failure for the slope can be calculated.
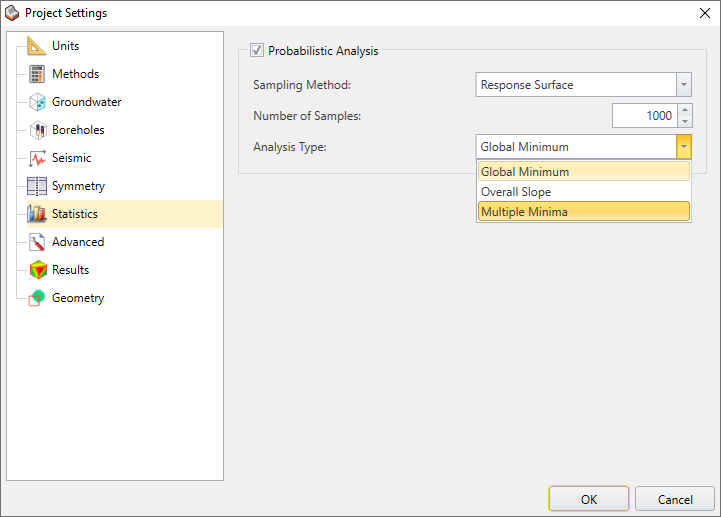
Probabilistic Analysis Project Settings
Probabilistic Analysis settings are configured in a new Statistics Project Settings tab. The tab allows you to set the following options for performing the analysis:
The Sampling Method determines the method of obtaining the samples from the distribution. The choices are: Monte-Carlo, Latin-Hypercube, and Response Surface. Response Surface is a sampling method that uses strategically selected samples to form a response surface of factor of safety values and predicts factor of safety for new combinations of samples.
The Number of Samples determines the number of samples obtained from the analysis.
The Analysis Type determines the slip surfaces analyzed. The choices are: Global Minimum, Overall Slope, and Multiple Minima. Overall Slope finds the slip surface for every simulation, resulting in several global minimum slip surfaces, and calculates Probability of Failure. Multiple Minima is a middle ground between Global Minimum and Overall Slope, by analyzing multiple pre-determined slip surfaces in each simulation. The main difference is that multiple slip surfaces from the initial search iteration are used to carry out the analysis instead of a single deterministic global minimum slip surface.
Defining Random Variables
With the introduction of Probabilistic Analysis to Slide3, a new Statistics menu has been added to allow the selection of model input parameters (only Material Properties in this version) and their definition as random variables.
This is done by selecting a Statistical Distribution for each selected parameter (random variable) and entering the appropriate parameters for the distribution (Mean, Standard Deviation, Relative Minimum, and Relative Maximum).
Other Features and Enhancements in Slide3
Other new features and enhancements in Slide 3 include the following:
- Ability to export Safety Maps to a file with the Factor of Safety data
- Addition of Tensar and Maccaferri geotextiles to the Common Support Types Library
- Ability to get a summary of error codes with descriptions
- Three new tutorials: Borehole Manager, Seepage Analysis, and Probabilistic Analysis
- Improvements to the Info Viewer
- General UI Improvements
Learn Slide3
Explore the Slide3 user guide for in-depth instructions on how to use the program and visit our library of learning resources, including case studies, past webinars, and articles, designed to expand your geotechnical knowledge and help you get the most out of your analysis.