The Latest Features in Slide2
Slide2 is a dynamic 2D Limit Equilibrium Analysis program designed to overcome your most challenging slope stability problems. Slide2 can be used for a variety of applications including dams, excavations, open-pit mining, and more.
Stay up to date with the latest Slide2 features and integrations that you can incorporate into your geotechnical projects.
April 2023
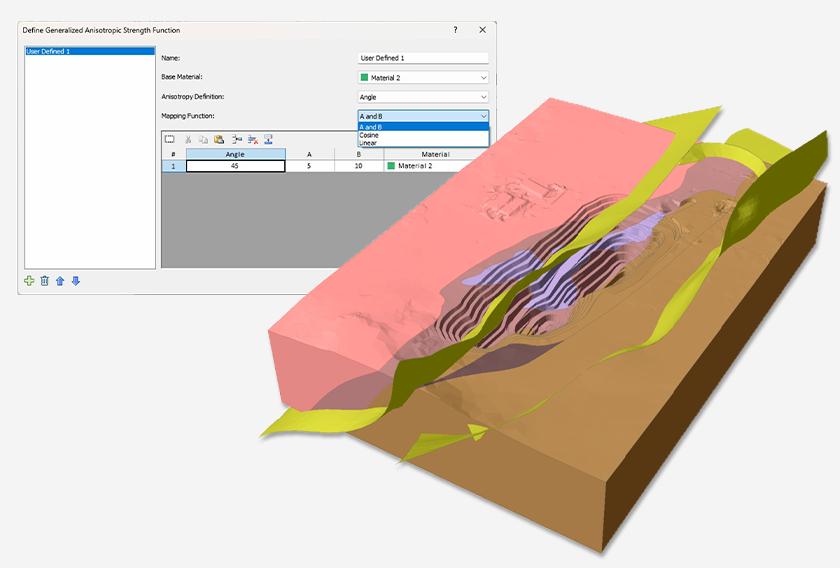
Mapping Functions
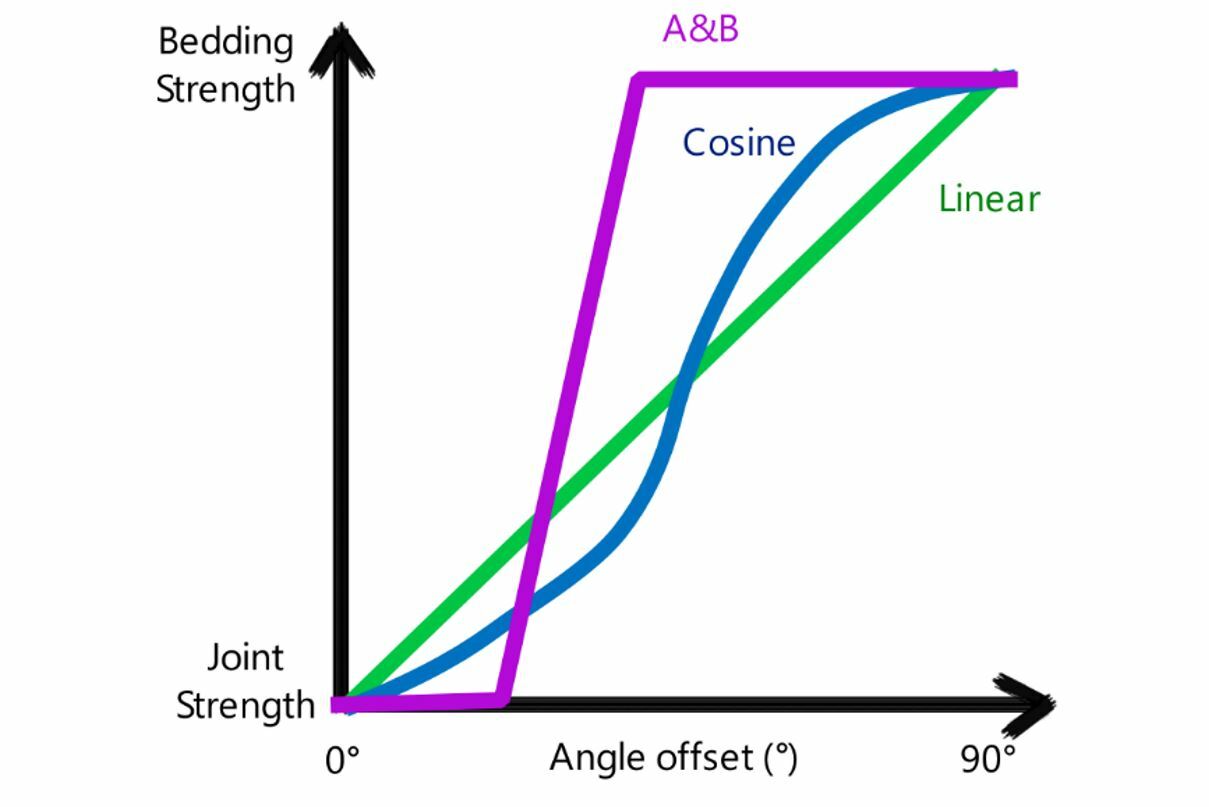
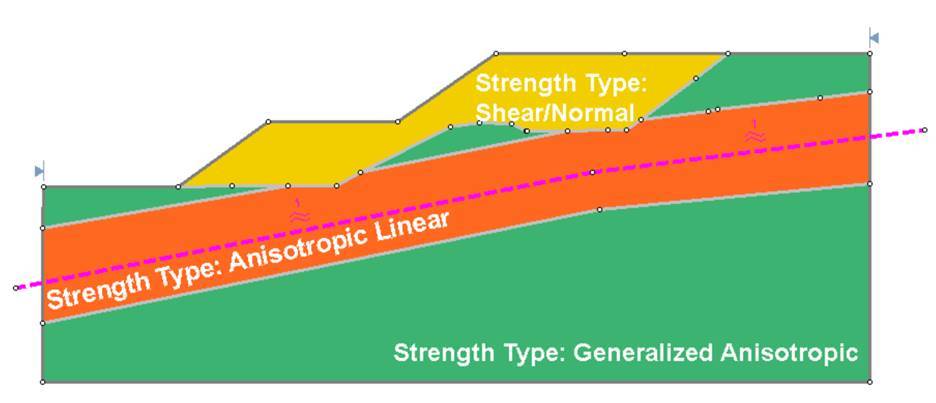
The new mapping function dropdown will be added to the latest versions of Slide2 (v9.028) and Slide3 (v3.022). This option gives you the ability to select different interpolation methods. The options will be:
- A and B – as discussed above.
- Linear – interpolates the strength linearly based on the difference between the angle of the slice base and the angle of the joint (i.e. the angle offset). If the angle offset is zero, then the joint material is adopted, whereas if the angle offset is 90° (perpendicular to the joint direction), then the base material is adopted.
- Cosine – interpolates the strength based on the cosine of the angle offset. If the cosine of the angle offset is 1, then the base strength is used. If the cosine of the angle offset is 0, then the joint strength is used.
A figure showing the interpolation schemes associated with the available mapping functions is shown below.
Slide3-Slide2 Generalized Anisotropic Integration
When exporting your anisotropy from Slide3 to Slide2, it is important that the anisotropy be detectable in the 2D section. In the case of a narrow range for the values A and B, for example, that are smaller than the angle range between the dip direction of the 2D section and the dip direction of anisotropy, the 2D section won’t be able to detect the anisotropy at all. When using the anisotropic integration, a more inclusive mapping function is recommended such as Cosine or Linear.
February 2023
Export Anisotropy from Slide3 to Slide2
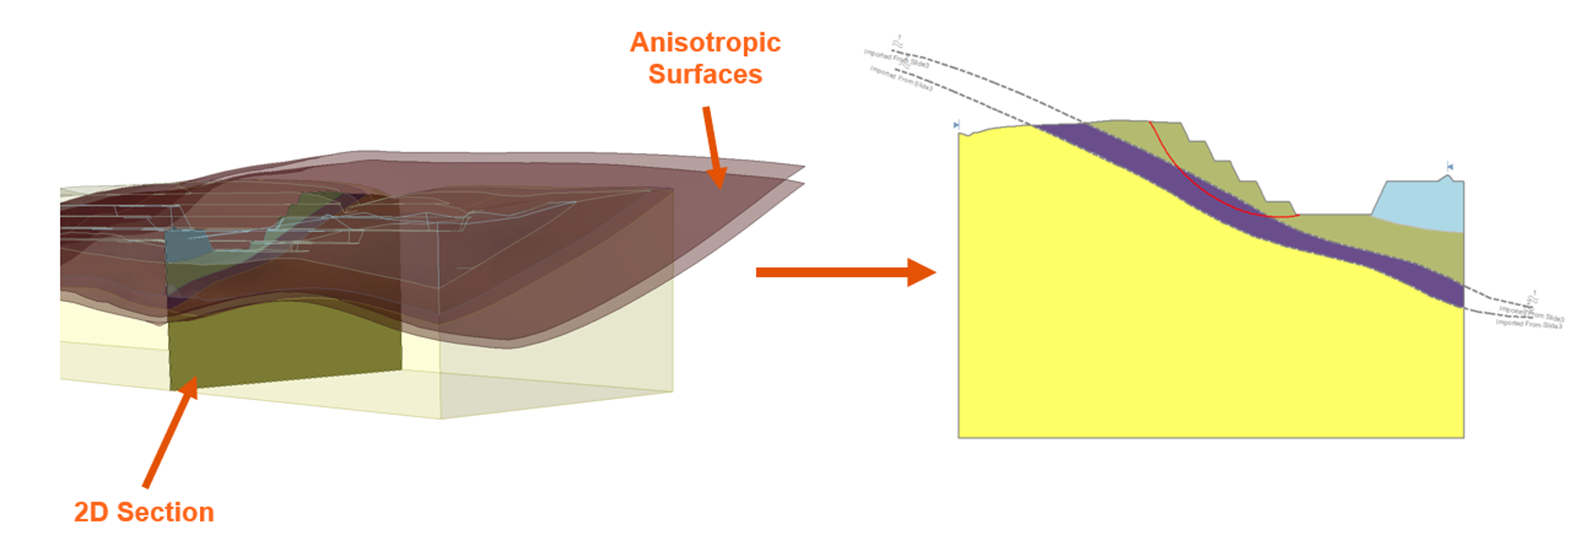
How do you export a 3D anisotropic surface to a 2D section?
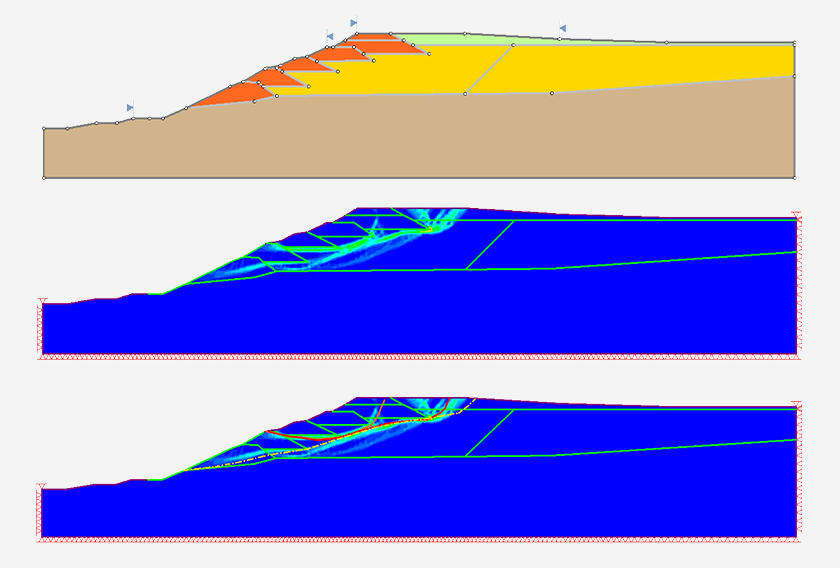
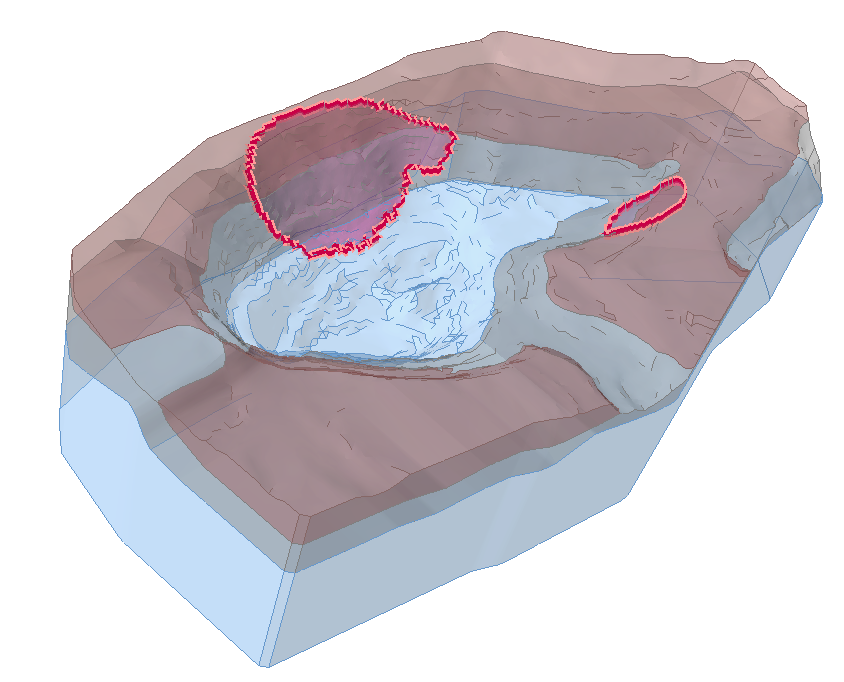
At first glance, an anisotropic surface should be exported from 3D to 2D like any other geometry piece. As seen below in the Slide3 model (Figure 1a), the maroon anisotropic surfaces will be cut at the location of the 2D section, creating the gray 2D anisotropic surfaces in the Slide2 model (Figure 1b).
Is it really this simple?
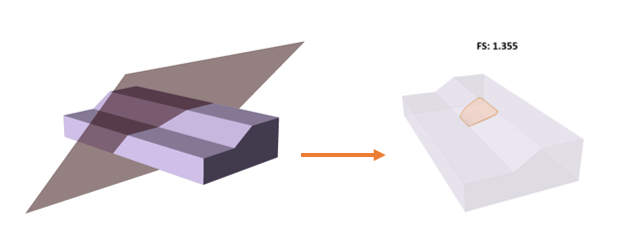
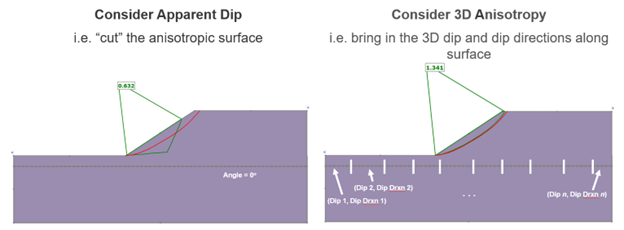
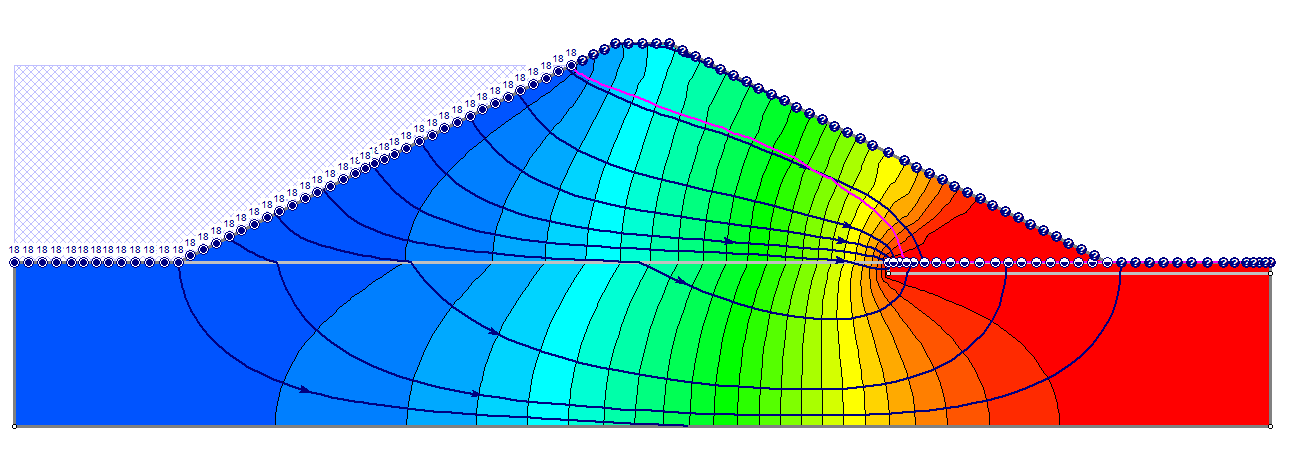
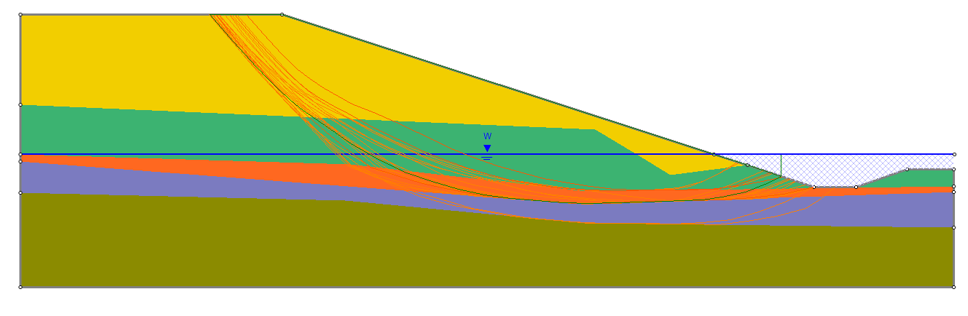
Consider the extruded slope with the anisotropic surface shown below (Figure 2). The factor of safety of this slope is 1.36 in Slide3.
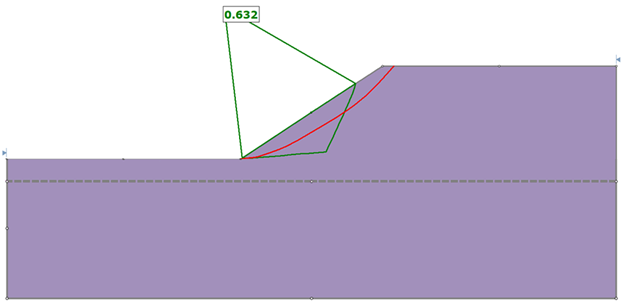
If we export this model to Slide2 using this simplified approach described in the previous section, the anisotropic surface is flat, and the global minimum tries to conform to that flat surface. This approach is called the “Apparent Dip” method. In this example, the factor of safety generated in Slide2 is 0.6 (Figure 3).
Considering 3D Anisotropy in 2D Analysis
In the most recent updates of Slide2 and Slide3, you will now have two options when exporting anisotropy from Slide3 to Slide2 (Figure 4). The “Consider Apparent Dip” method simply cuts the anisotropic surface. The “Consider 3D Anisotropy” method imports the dip and dip direction at each segment along the anisotropic surface.
Which method is correct?
No matter how you look at it, you are trying to represent a 3D object on a 2D plane – there’s no “correct” way of doing it – it’s not possible. You need an assumption that’s best for your model. What does it mean to select each method?
- Consider Apparent Dip: Cut the anisotropic surface at the location of the Slide2 section. This is a pure 2D analysis where the 2D section doesn’t know about the 3D anisotropy around it.
- Consider 3D Anisotropy: Since we are taking a 2D section inside of our 3D model, we want the 2D model to be aware of the true 3D anisotropic surface so that our 3D and 2D results are more comparable.
Where are these options in the software?
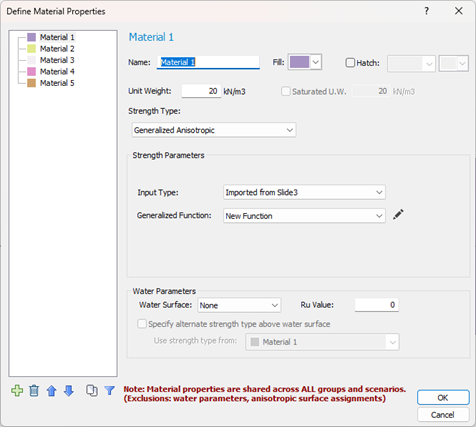
When exporting a 2D section from Slide3 with a Generalized Anisotropic material type, the process will be the same as usual. In Slide2, you will notice that the material will be imported as Generalized Anisotropic of Input Type = “Imported from Slide3”. This option is only available when you are looking at a Slide2 file created from Slide3 with a Generalized Anisotropic material type.
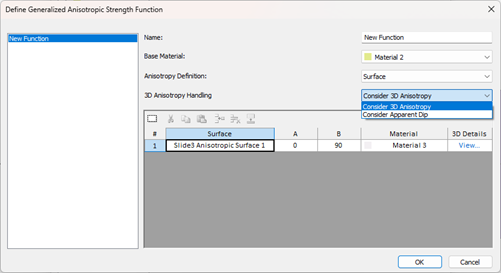
Upon clicking on the pencil to edit the function, you will see the usual Generalized Anisotropic Strength Function dialog, with the additional 3D Anisotropy Handling dropdown, where you can select how you want the anisotropy to be considered.
Why did we add this feature?
The end goal of numerical modelling is to represent the actual conditions as closely as you can. 3D software tools like Slide3, provide you with the capability to realistically consider anisotropy. By adding this functionality to the integration between Slide2 and Slide3, you can better compare your 2D and 3D analyses and be more confident in your results.
Learn more about how this functionality works, or go through the step-by-step tutorial.
November 2022
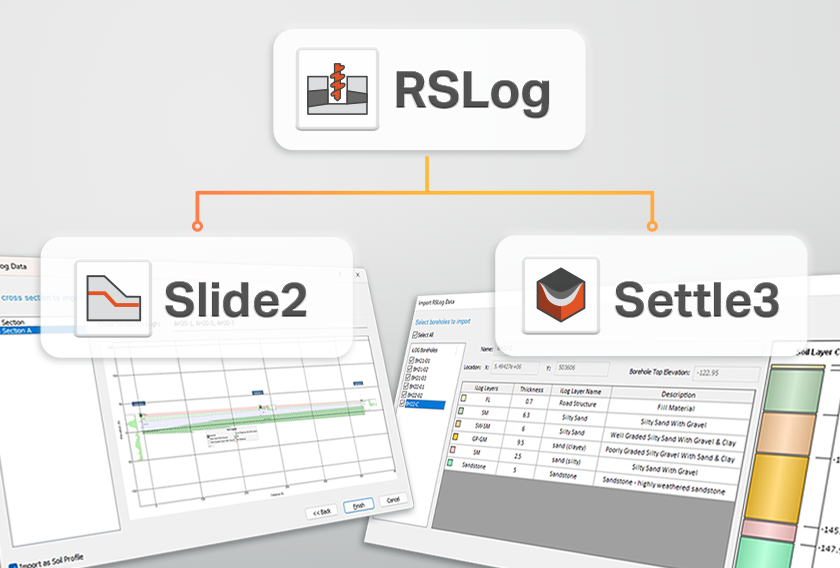
Slide2 - RSLog Integration
RSLog is Rocscience’s easy-to-use web-based borehole log application. It allows users to log their test borehole data on an online platform which can be accessed from anywhere, on any device. One of the newest features in RSLog is the cross-section designer. With this feature, the engineer can design cross sections between their test holes and modify the cross sections to their liking with simple CAD tools.
In the latest update of Slide2 (v9.025) we have integrated with RSLog, allowing users to easily import their RSLog cross sections into Slide2.
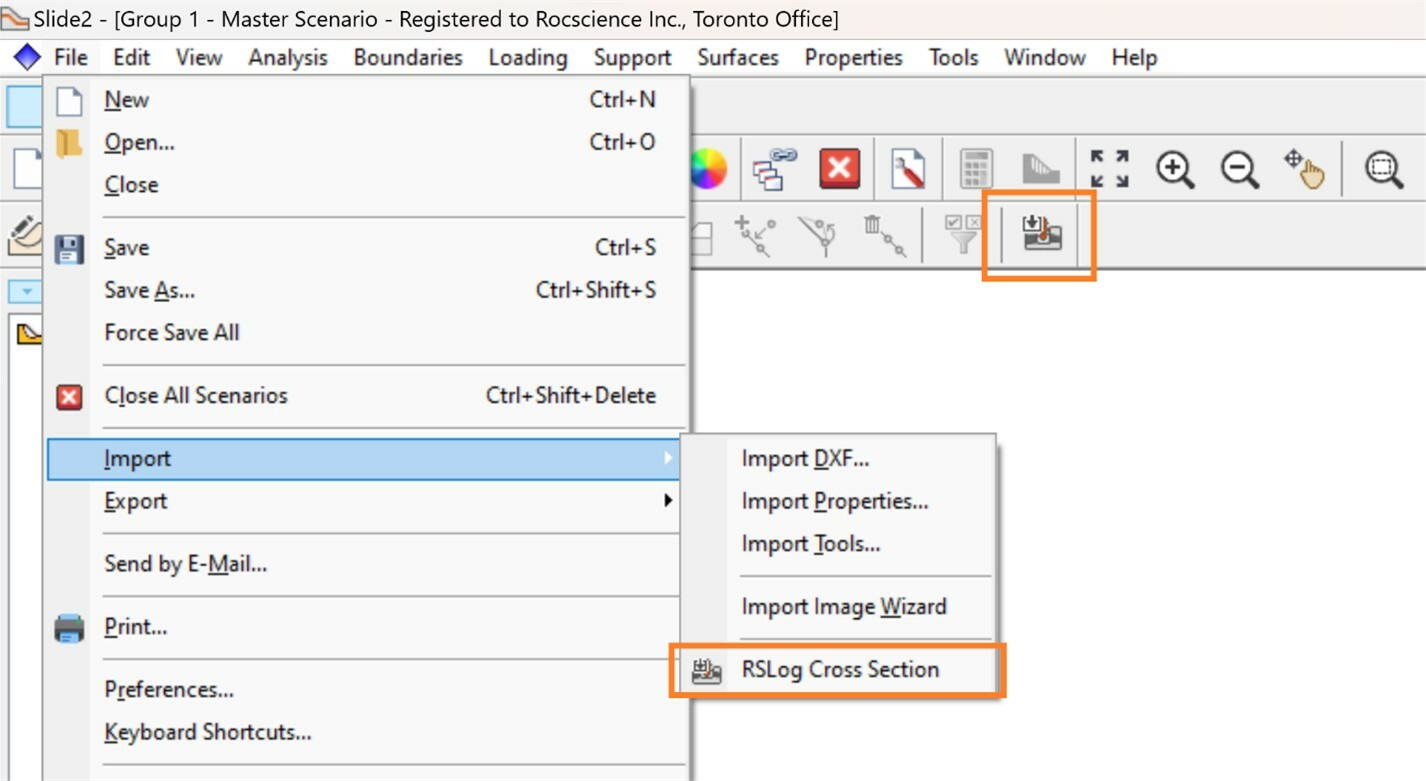
To access the feature in Slide2, select File > Import > RSLog Cross Section, or select the RSLog Import button in the toolbar.
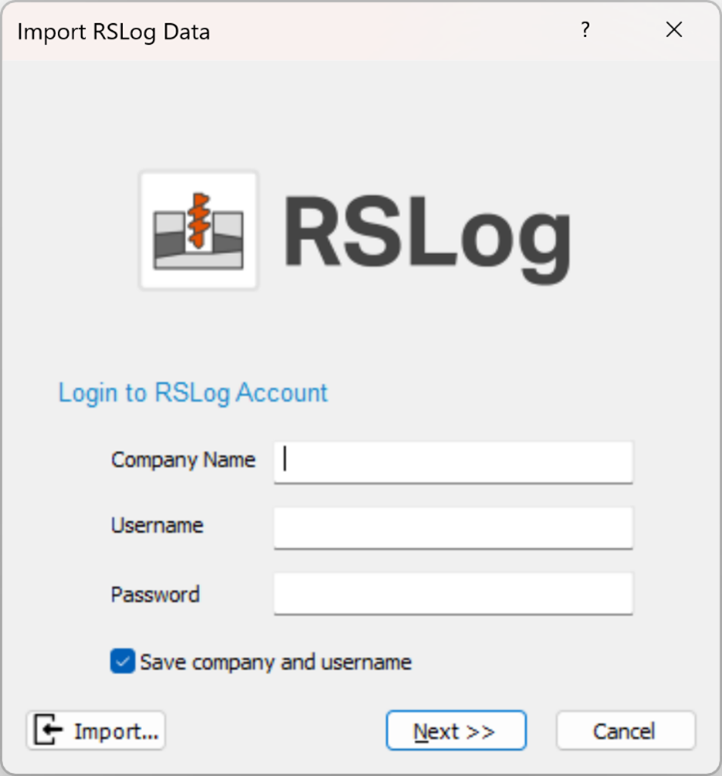
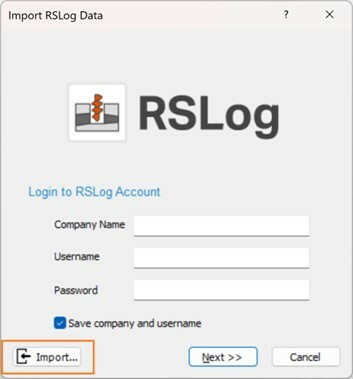
Online Import
Input your company credentials in the resulting dialog and click Next.
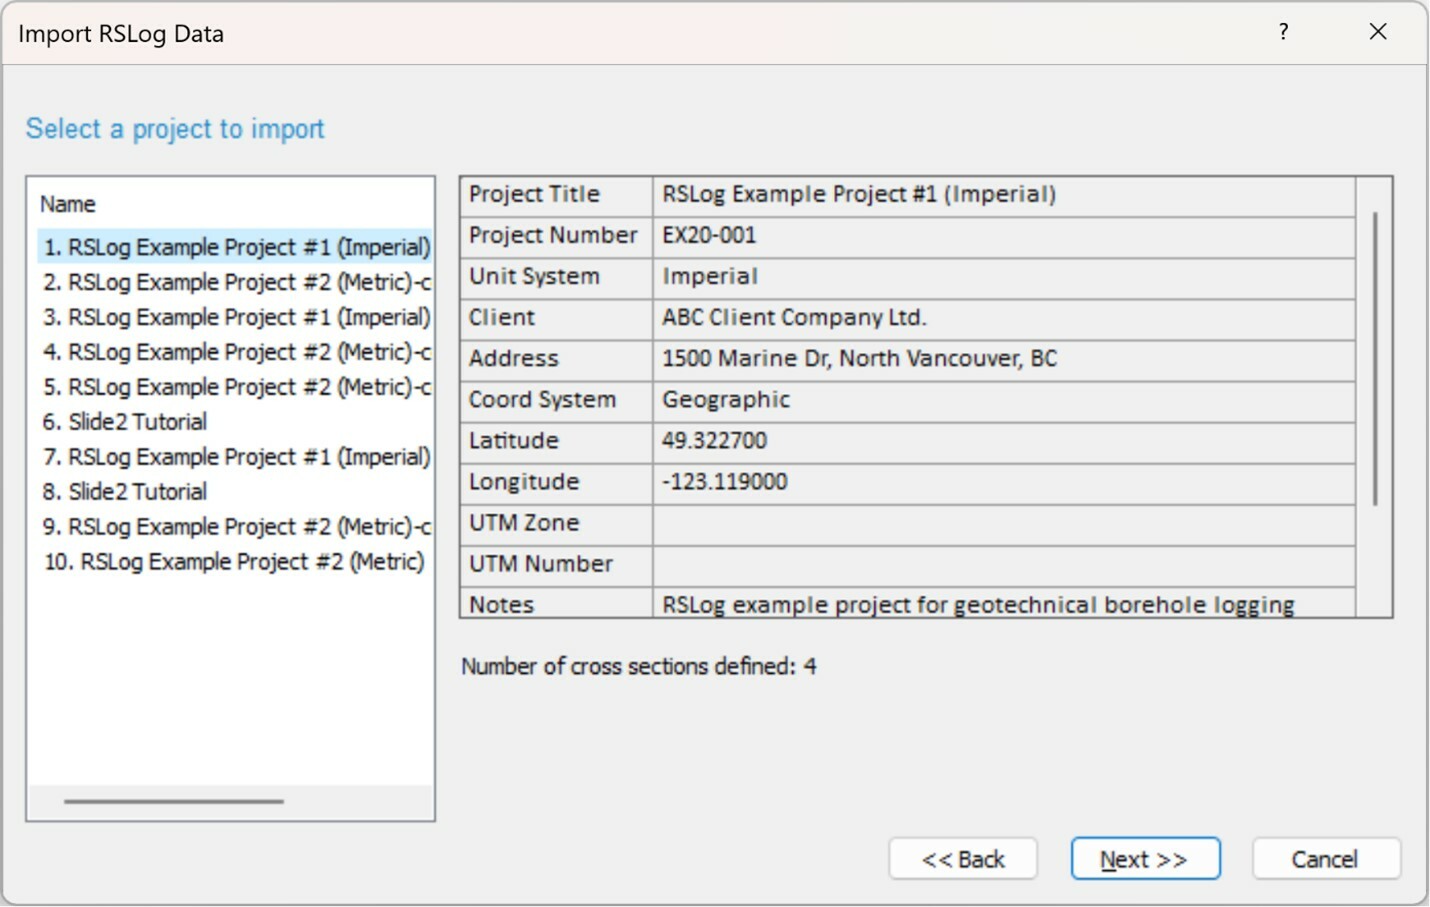
Slide2 will log into your RSLog account live, and you will be taken to the list of projects you have defined in your account, along with an indication of how many cross sections are defined in each project.
After selecting the desired project and clicking Next, the final page will show you the cross sections you have defined in that project along with a preview image:
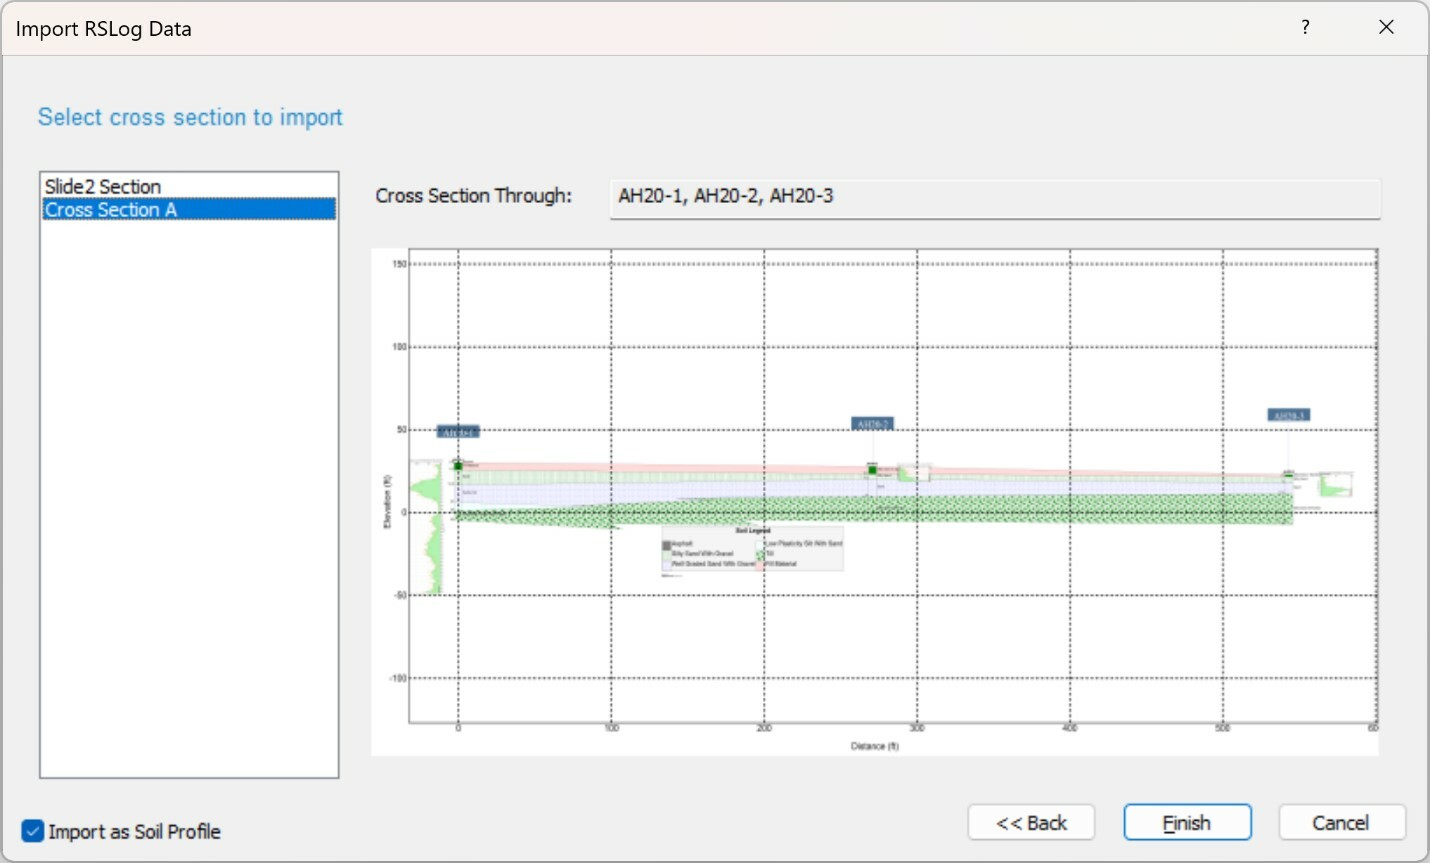
By default, the “Import as Soil Profile” box is on. This will bring the cross section in as a soil profile and allow you to cut the desired slope out of the profile. Alternatively, it can be unchecked to bring the soil profile in as the final slope.
Note that all the material names, material colours, and piezometric lines will be imported, but material properties and piezometric line assignments are left to the user.
Offline Import
Worried about your internet connection in the field? Export your cross-section from RSLog ahead of time and save it to your machine. In your RSLog cross-section, select Export > Rocscience Section (JSON):
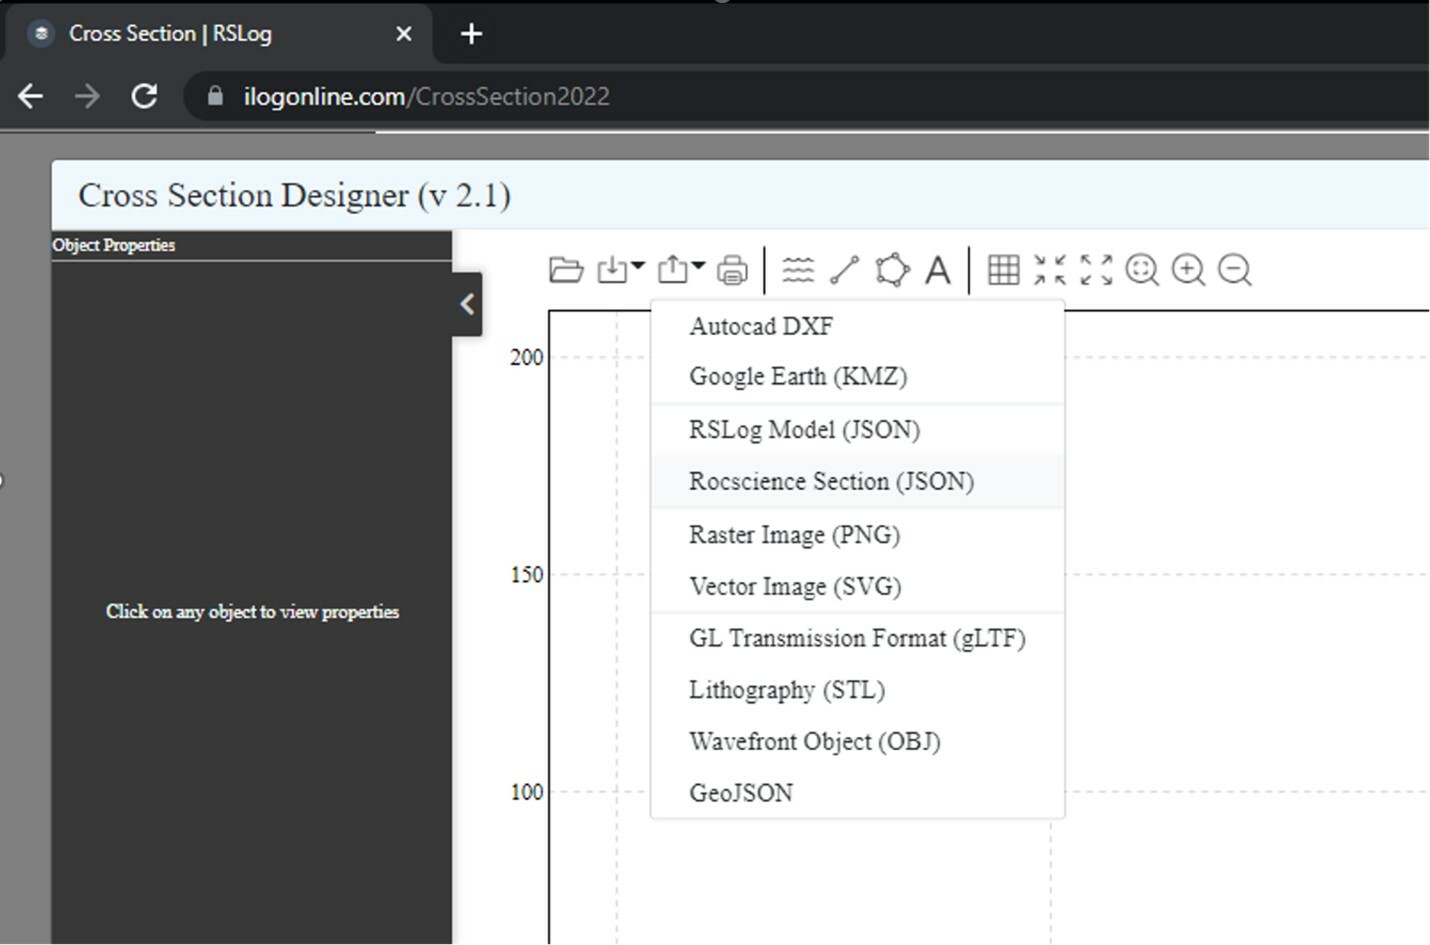
Then import it to Slide2 using the Import button in the dialog:
August 2022
Manufacturer Library with Synteen Geogrids
The Slide2 Geogrid Library now includes Synteen’s 12 Uniaxial geogrids for you to choose from. If you have the latest version of Slide2 (Version 9.024) you can immediately start integrating Synteen Geogrids in your designs and avoid the need for manual entry of the parameters, ensuring efficient and cost-effective analyses.
The full list of Synteen geogrids available in the Slide2 geosynthetics library is listed below:
Uniaxial
- STF, Inc. Data Sheet – SF20
- STF, Inc. Data Sheet – SF35
- STF, Inc. Data Sheet – SF55
- STF, Inc. Data Sheet – SF65
- STF, Inc. Data Sheet – SF80
- STF, Inc. Data Sheet – SF90
- STF, Inc. Data Sheet – SF95
- STF, Inc. Data Sheet – SF110
- STF, Inc. Data Sheet – SF180
- STF, Inc. Data Sheet – SF190
- STF, Inc. Data Sheet – SF350
- STF, Inc. Data Sheet – SR18
November 2021
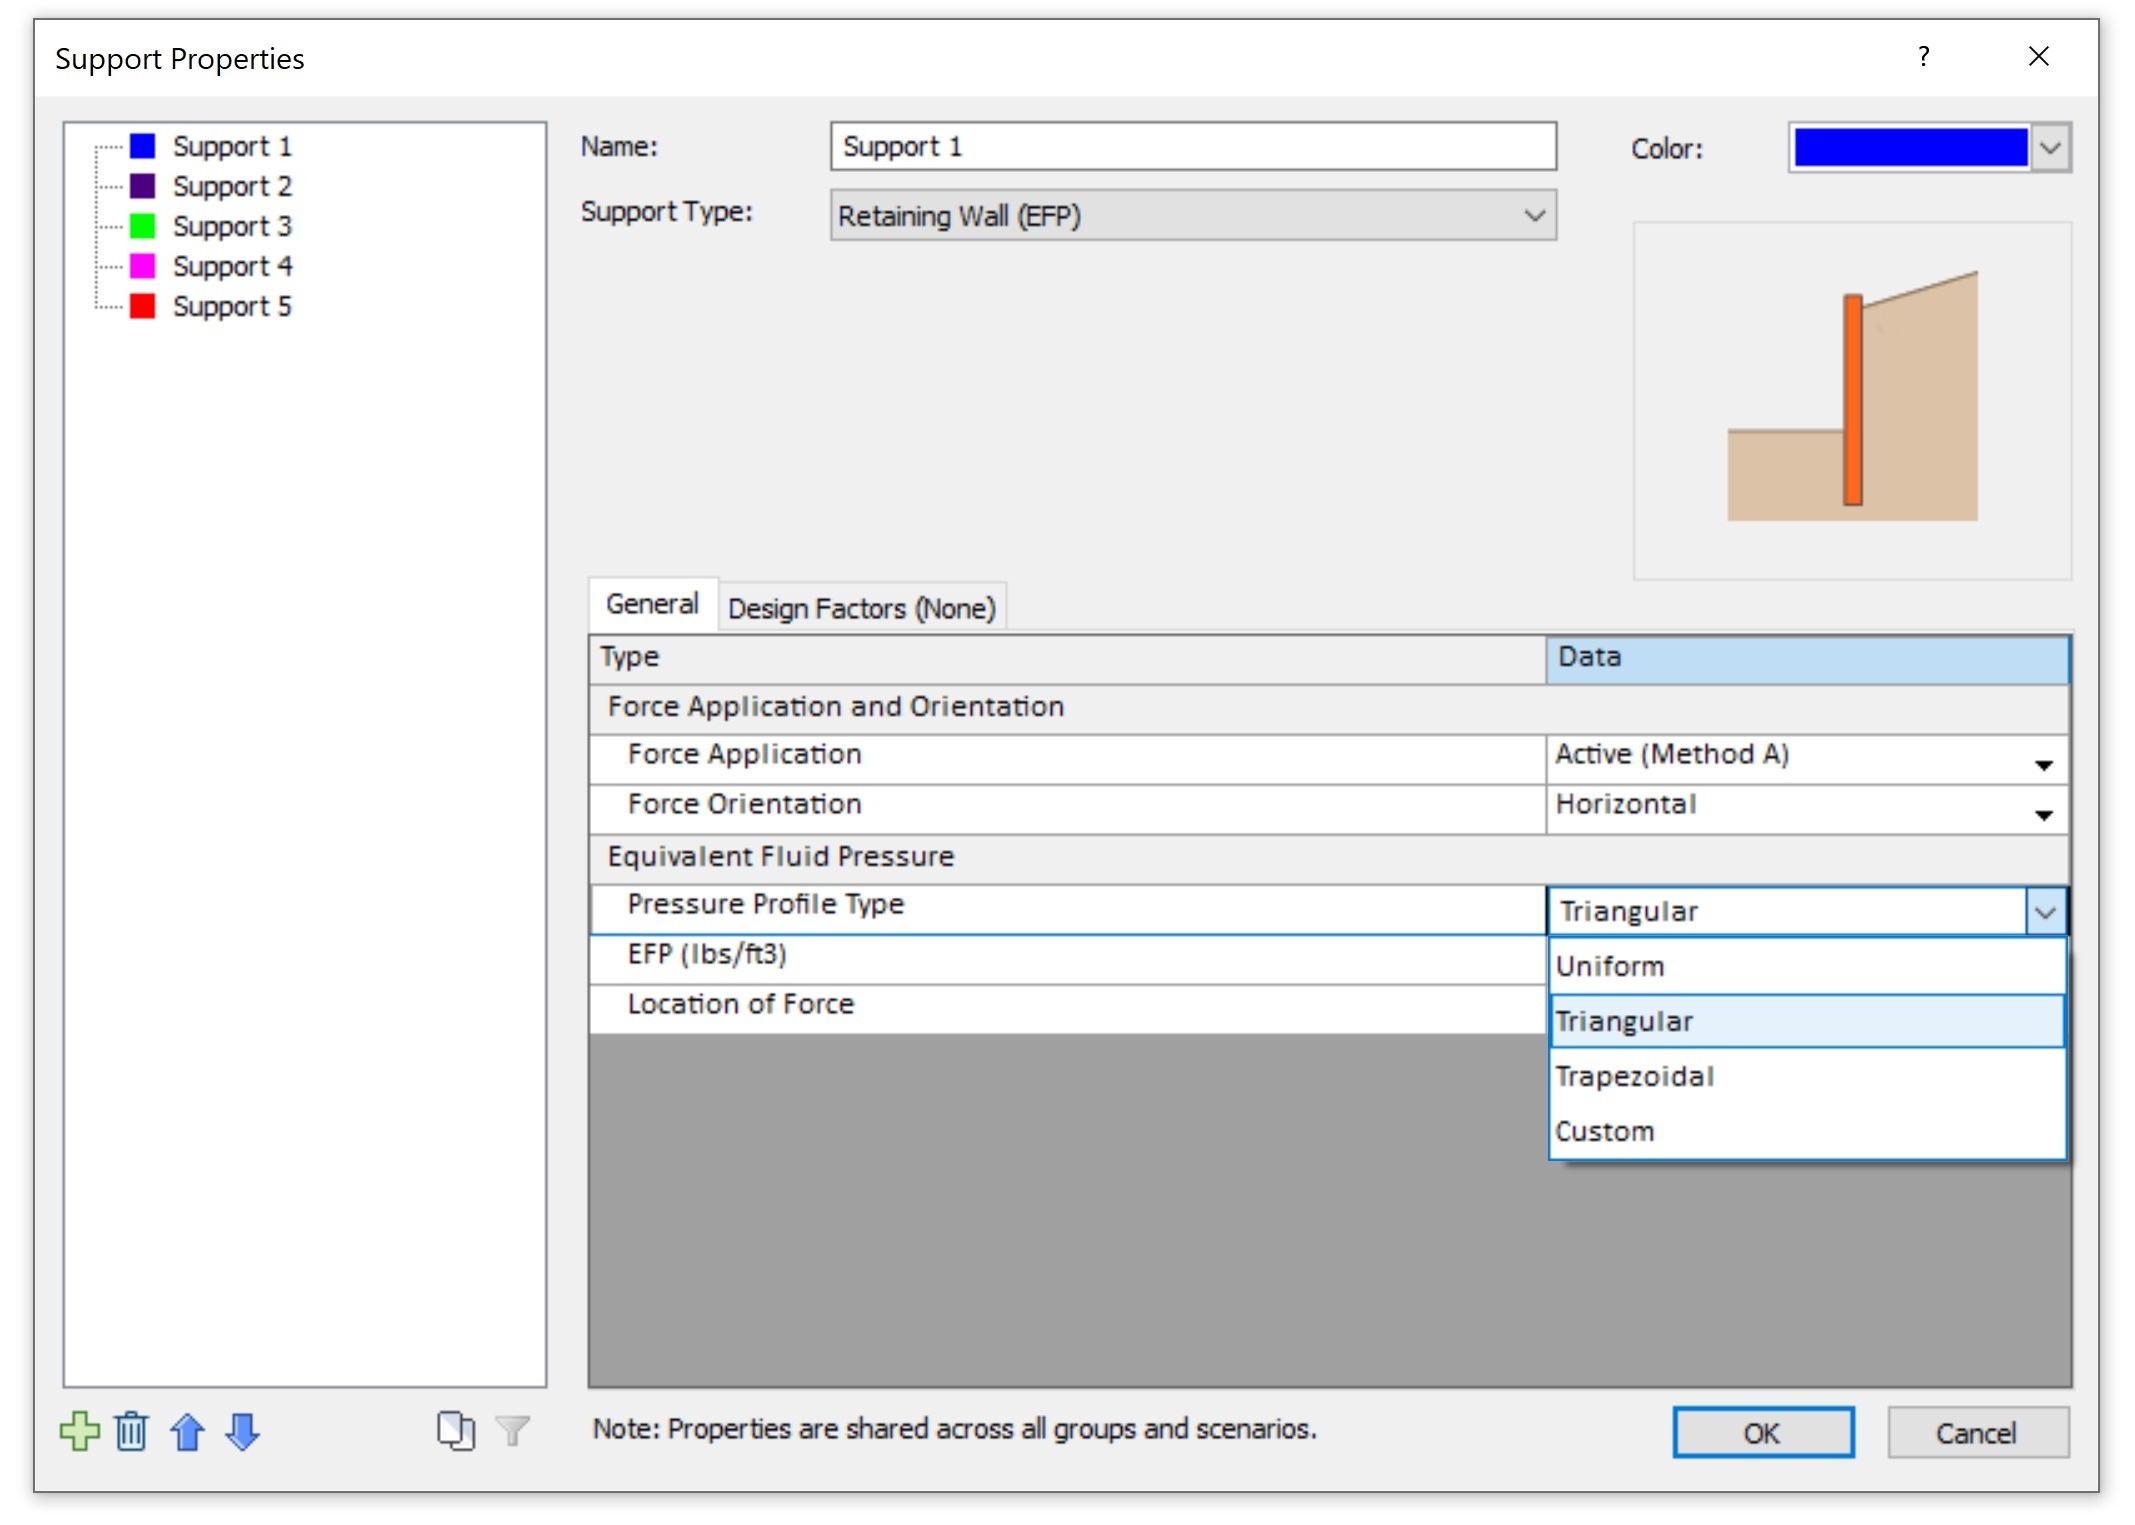
New Retaining Wall (ERP) Support
The purpose of this new support type is to allow users to evaluate the static and seismic stability of existing retaining walls with varying backslopes, and their effect on an existing slope or a newly graded slope. The new feature may also be used in conjunction with in-house spreadsheets/calculations to aid in the design of new retaining wall systems. Furthermore, a user can now easily evaluate how a retaining wall will perform against all types of circular and non-circular failures given the underlying geologic conditions.
For example, in the previous version of Slide2, if a user wanted to model a cantilevered retaining wall, they would do so by applying a distributed load to a vertical cut and assigning a triangular pressure distribution (Figure 1). The user would then increase the load until achieving the required factor of safety.
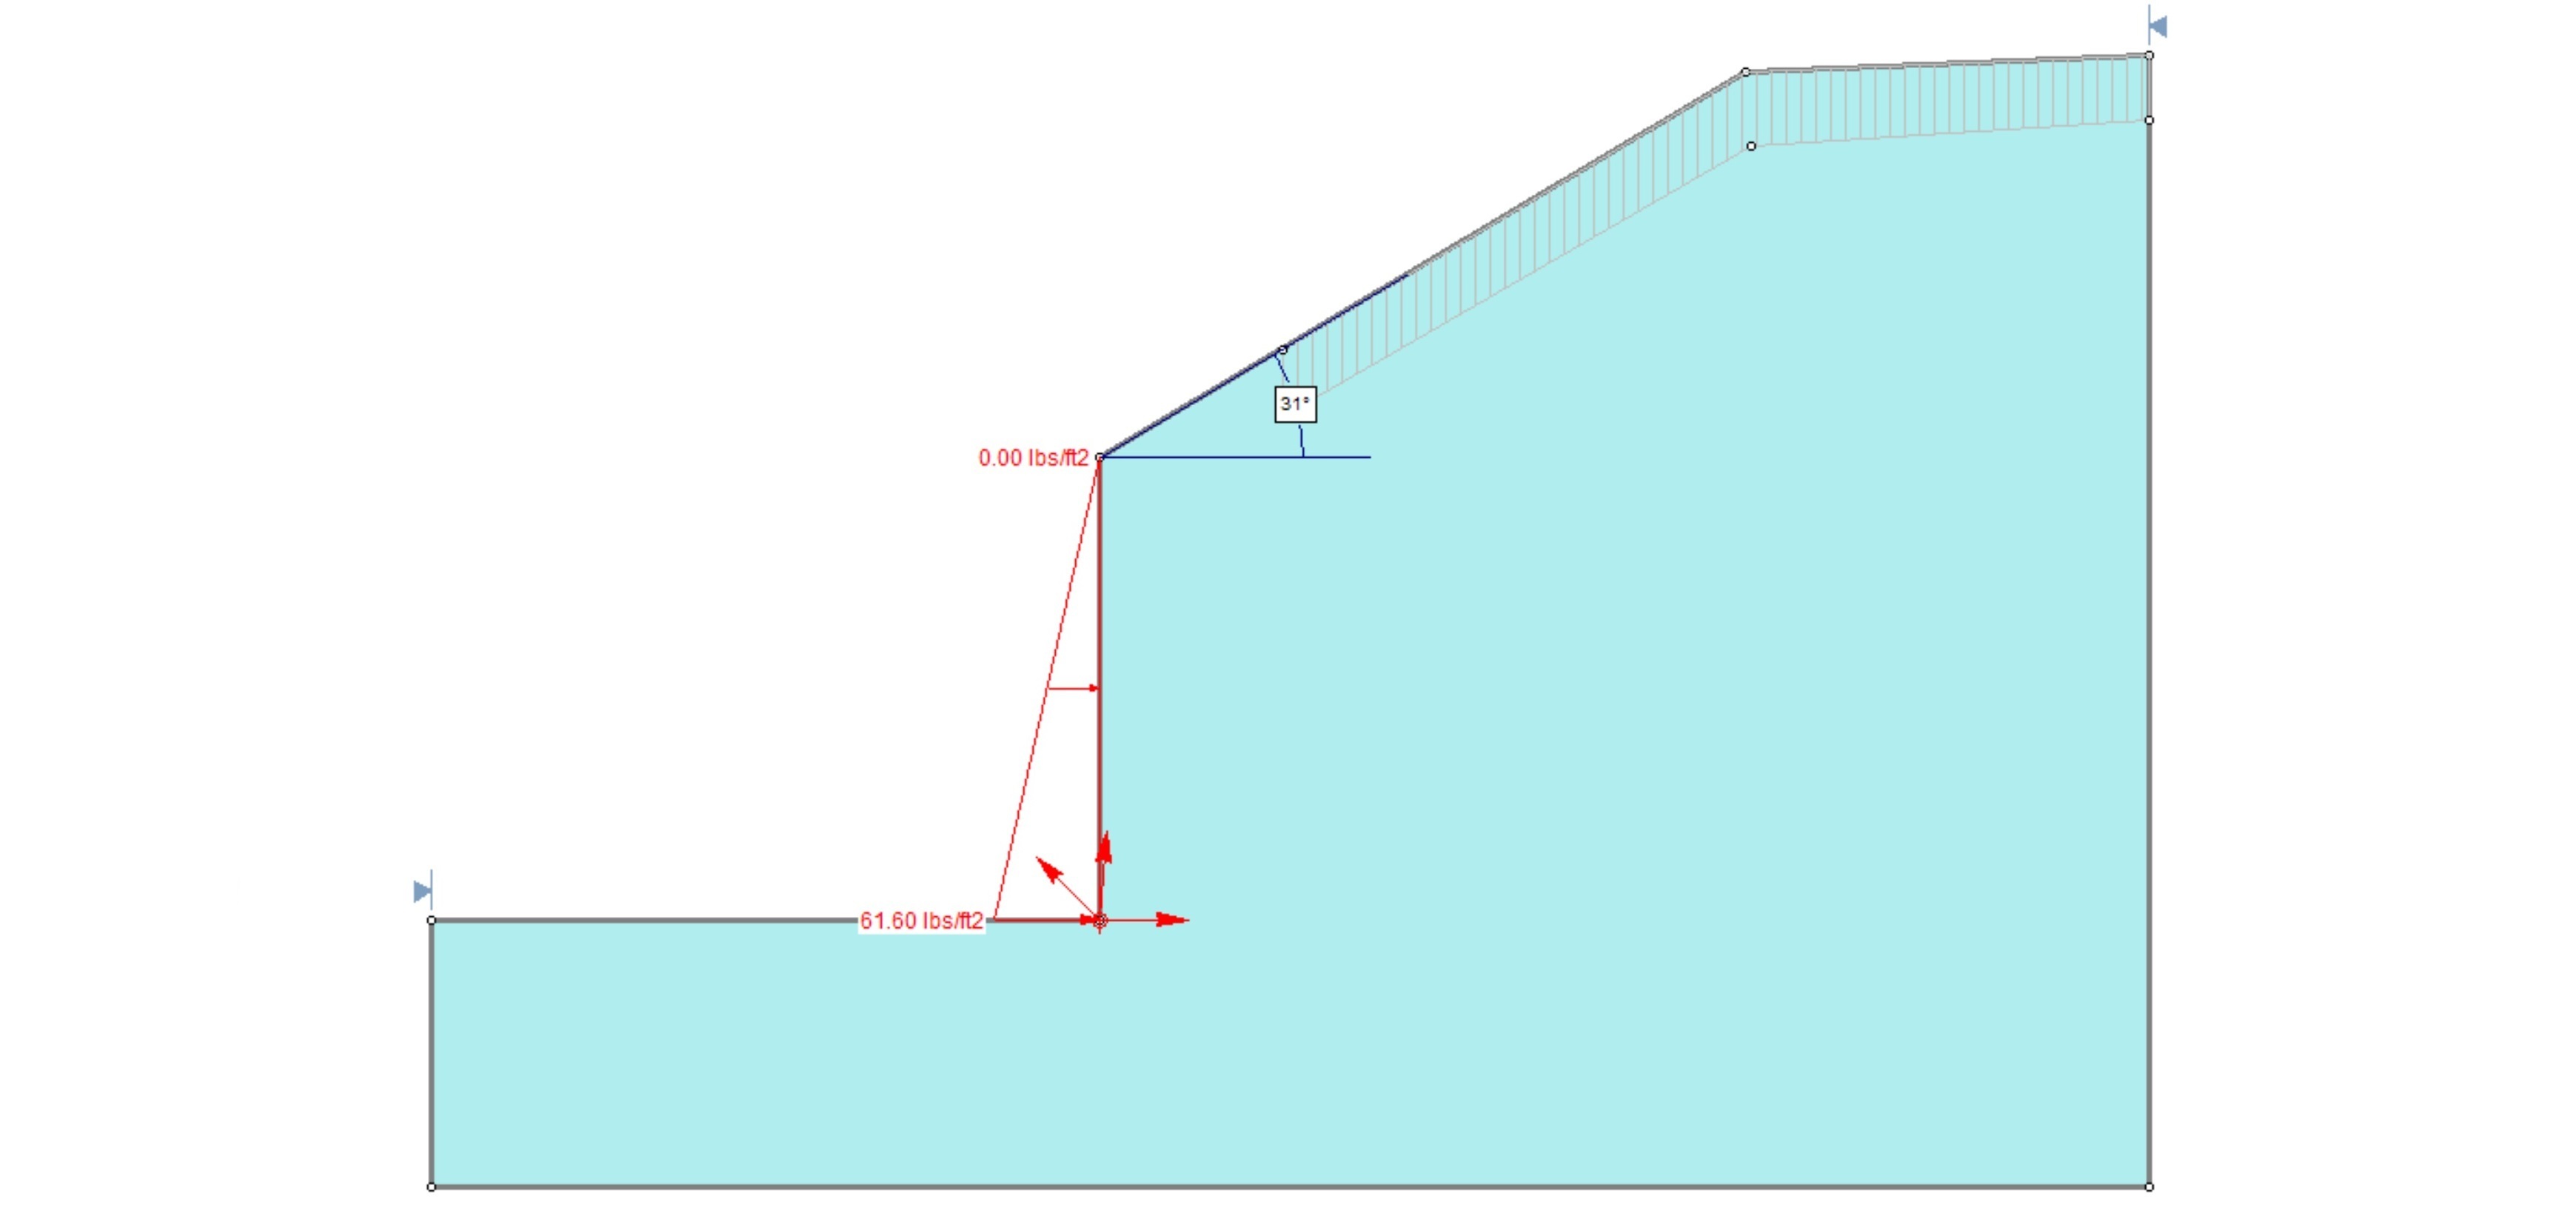
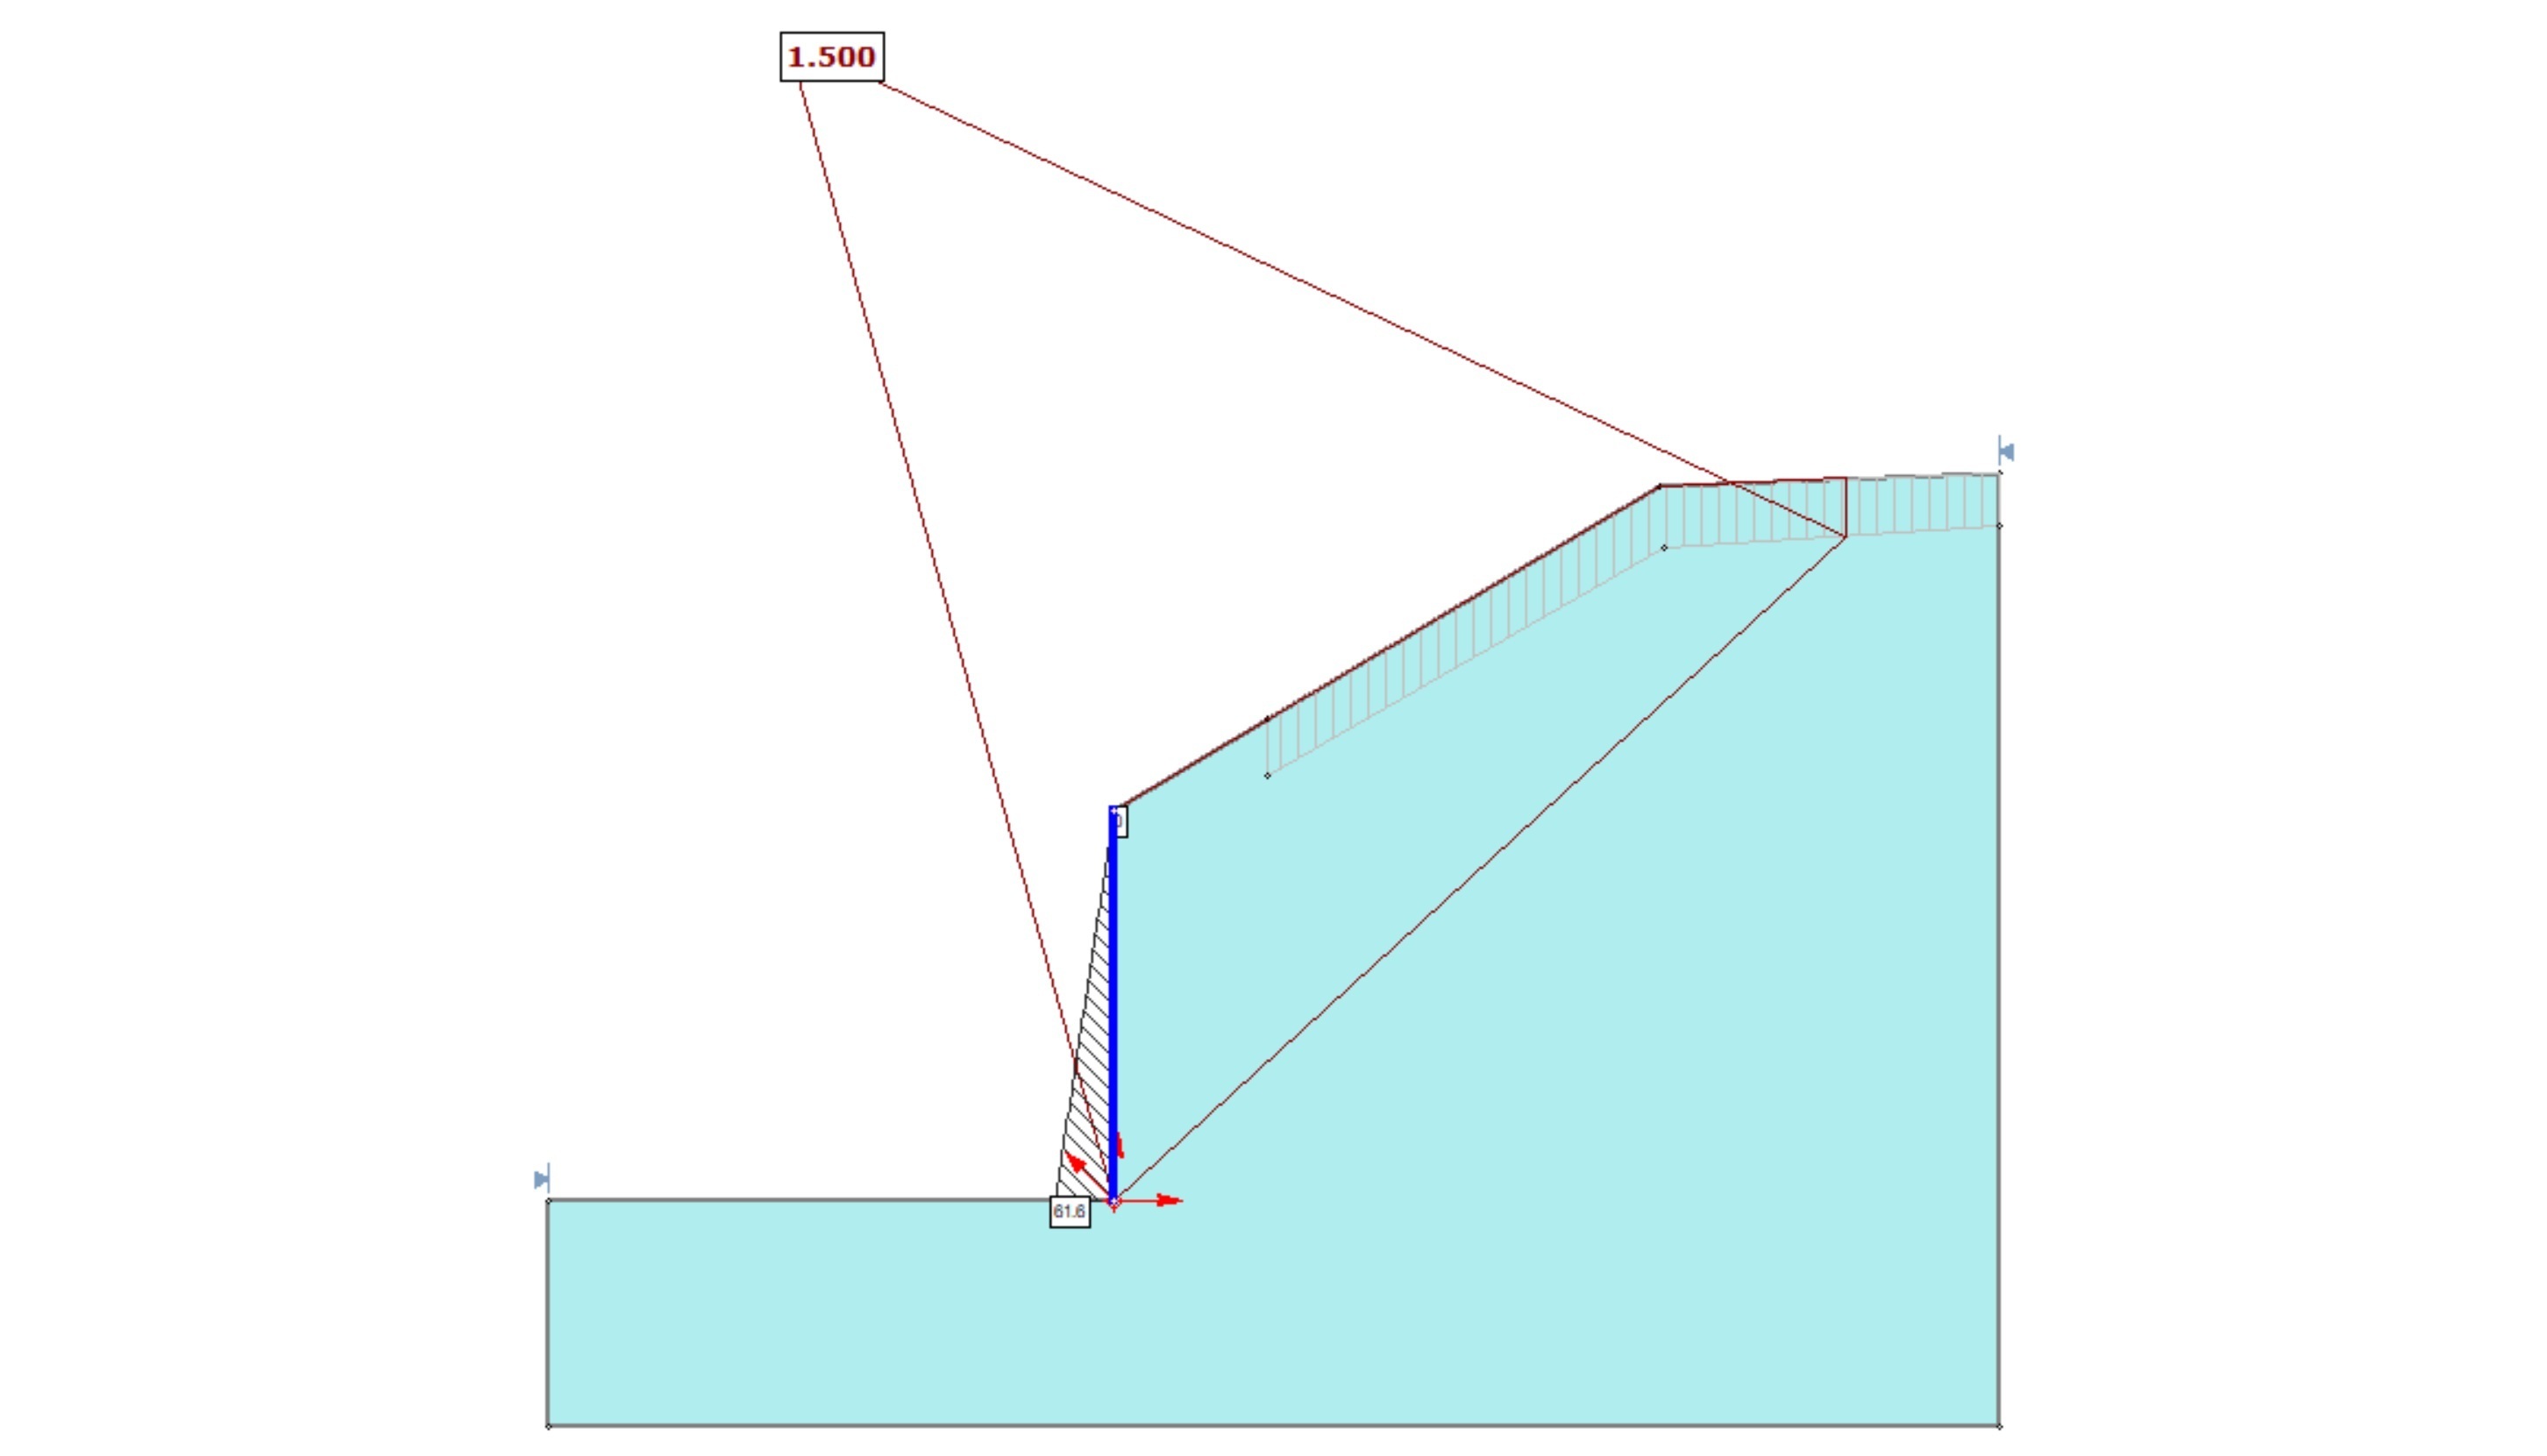
In this update, you can now easily add a retaining wall support, in the same way one adds piles, tiebacks, soil nails, etc. Additionally, you can now input the design as Equivalent Fluid Pressure (Figure 2, Figure 3).
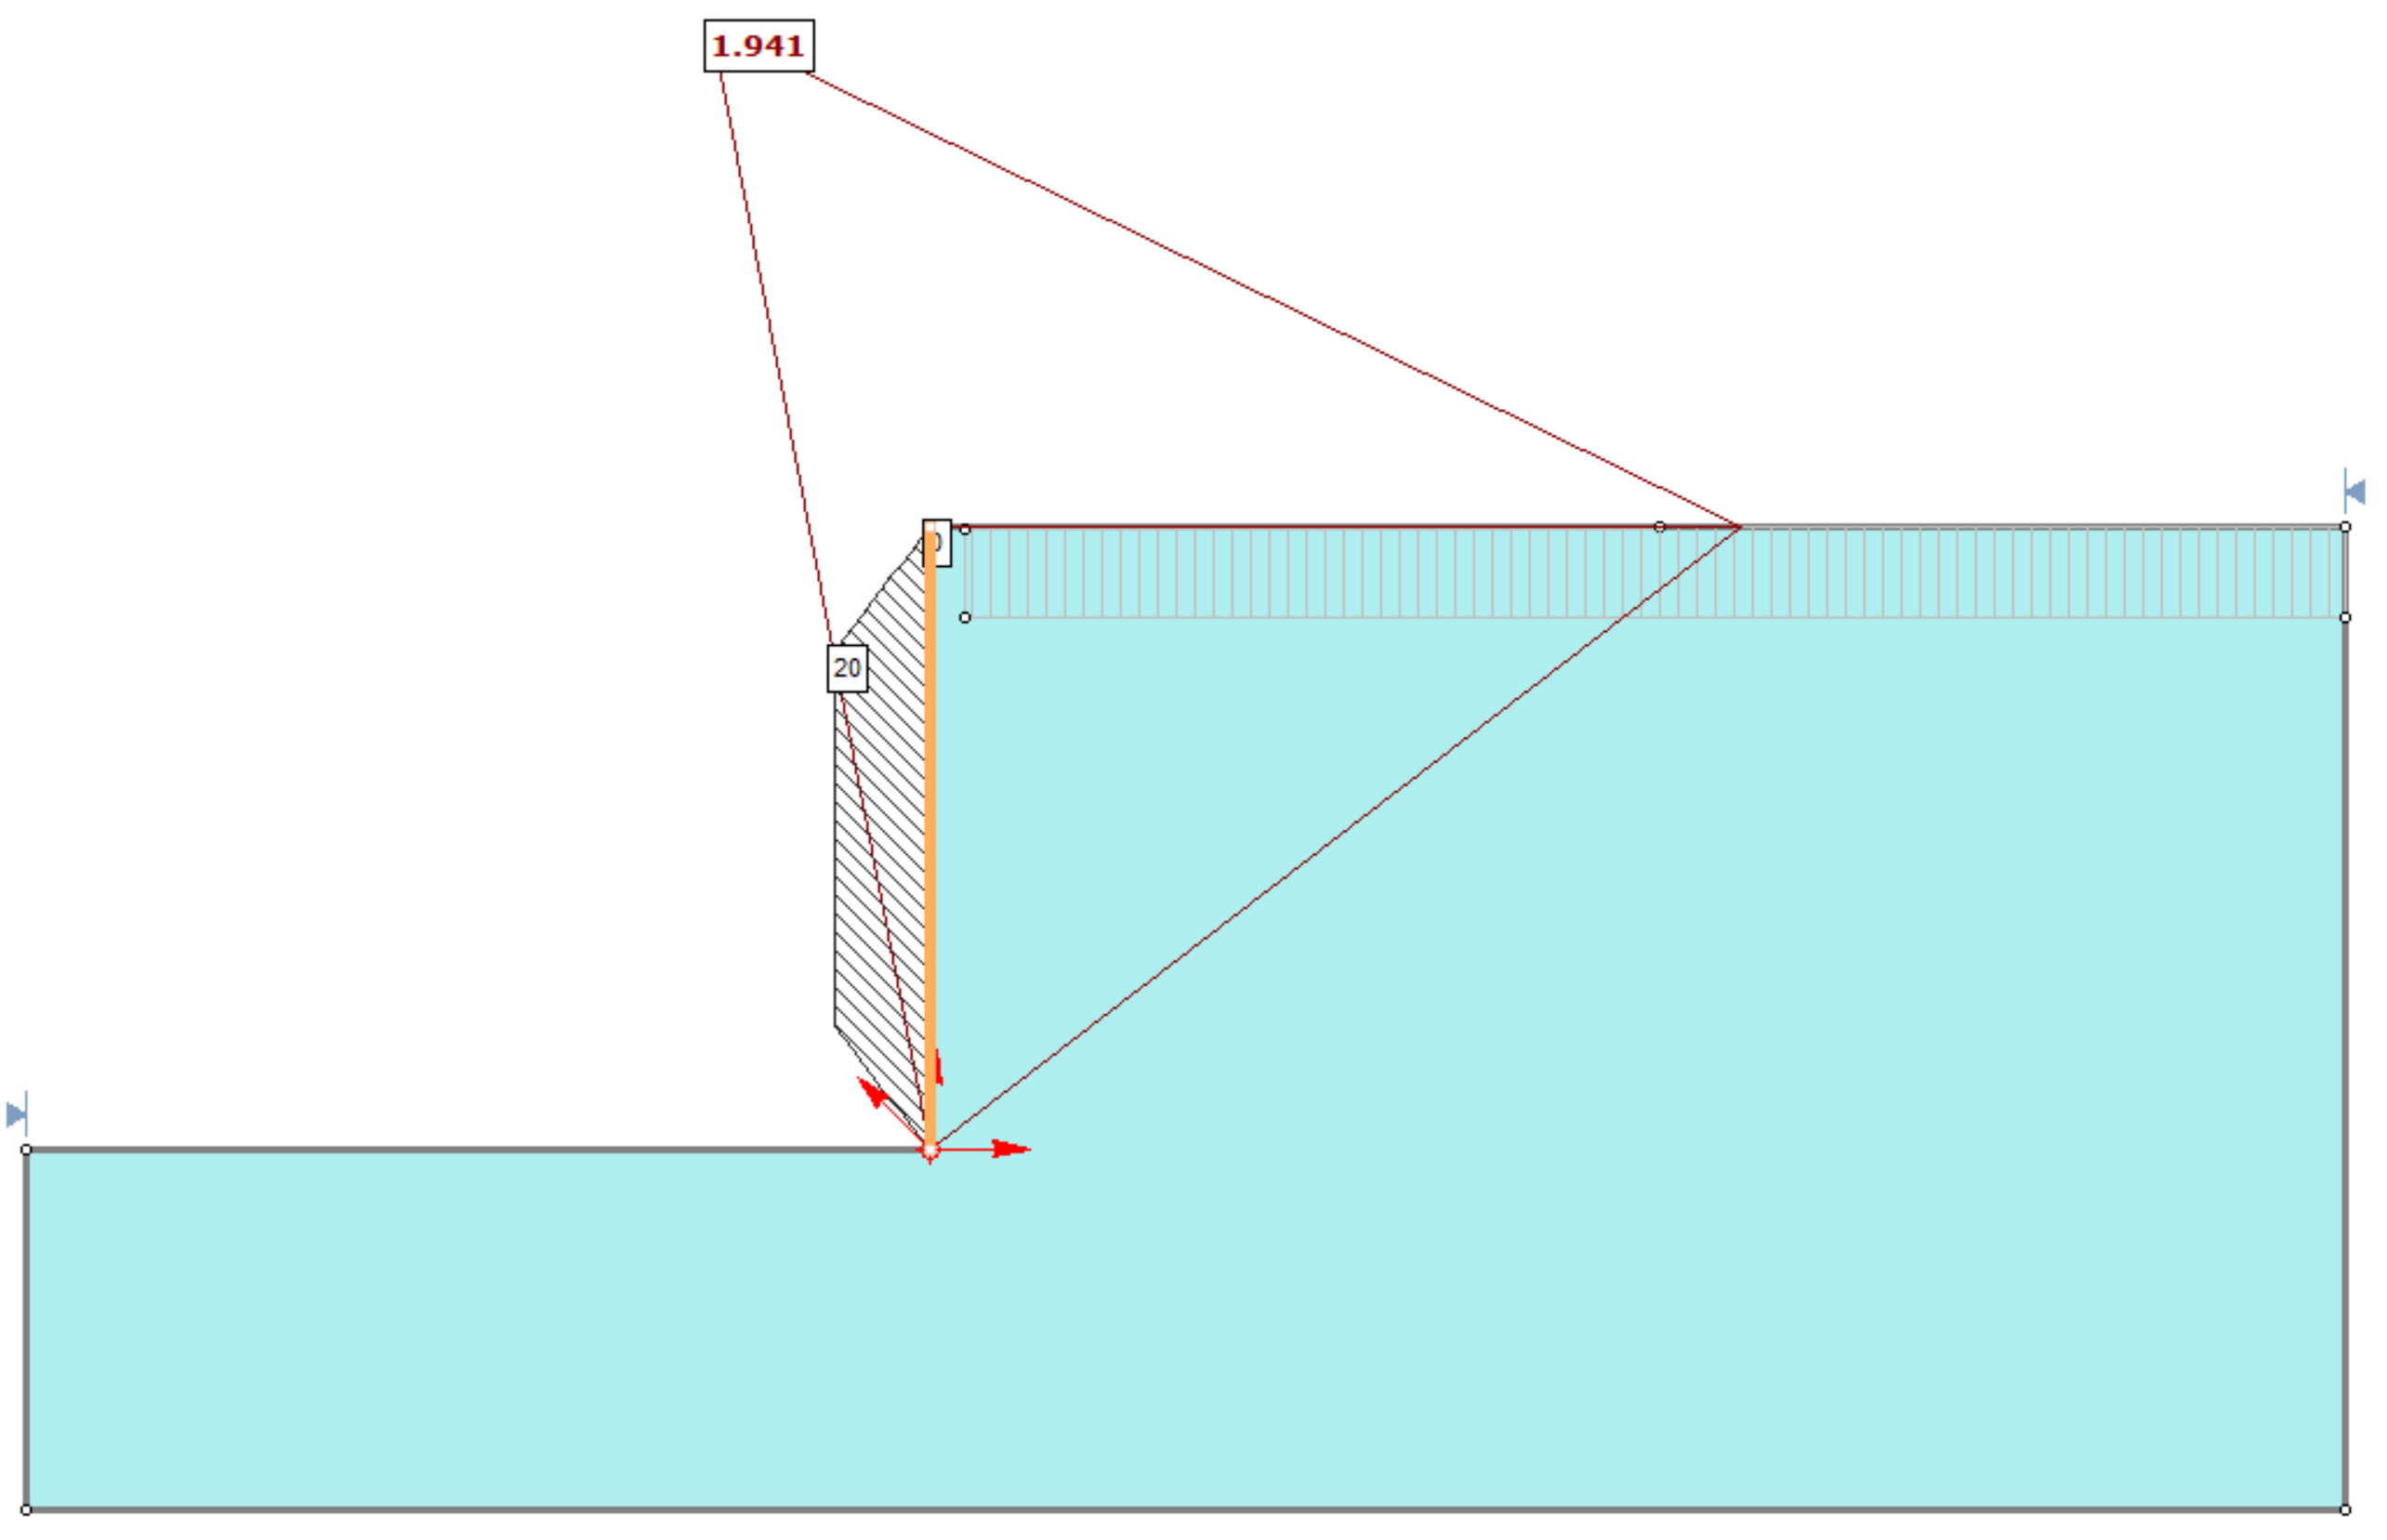
The same can be done to easily model a trapezoidal pressure distribution for restrained basement retaining walls or temporary shoring that utilizes tiebacks (Figure 4).
This feature not only saves time but also provides you with another set of tools to model the existing conditions of a site or design new retaining devices for new construction.
September 2020
Multi-Modal Optimization (MMO)
The Multi-Modal Optimization feature was introduced to help address some of the real-world complexities of analyzing a slope. Slope stability analyses generally focus on the search for the single global minimum surface. Yet in reality, a slope will often have multiple critical regions that may fail, instead of a single critical region. This is where MMO comes into play.
With the Multiple min option, the user can now let the algorithm search for multiple local mins instead of the single critical one – this is called multi-modal PSO. The parameter of note is the “radius span of search space.” The number of local mins found will be equivalent to the number of particles in the search (default 50 particles). As such many of these will be very similar. The radius option filters out the surfaces that are similar and only take the most critical local minima in each region.
Weak Layer Algorithm
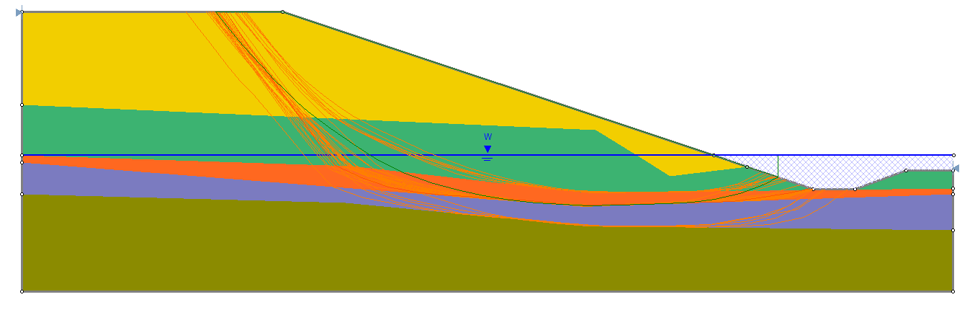
The Weak Layer option in Slide2 and Slide3, allows users to define a weak layer using only a polyline with assigned strength properties. Since a weak layer polyline has no physical thickness, it is intended to be used for modeling interfaces, joints, or very thin weak layers with negligible thickness, along which sliding could occur.
A new algorithm has been introduced for this feature to address cases where there may be multiple weak layers that overlap in the model. Sometimes, the material beneath a weak layer can be weaker than the weak layer itself. Thus, the Weak Layer Handling feature has been added. When the Weak Layer Handling feature is enabled, Slide can determine which configuration of weak layers produces the most critical slip surfaces.
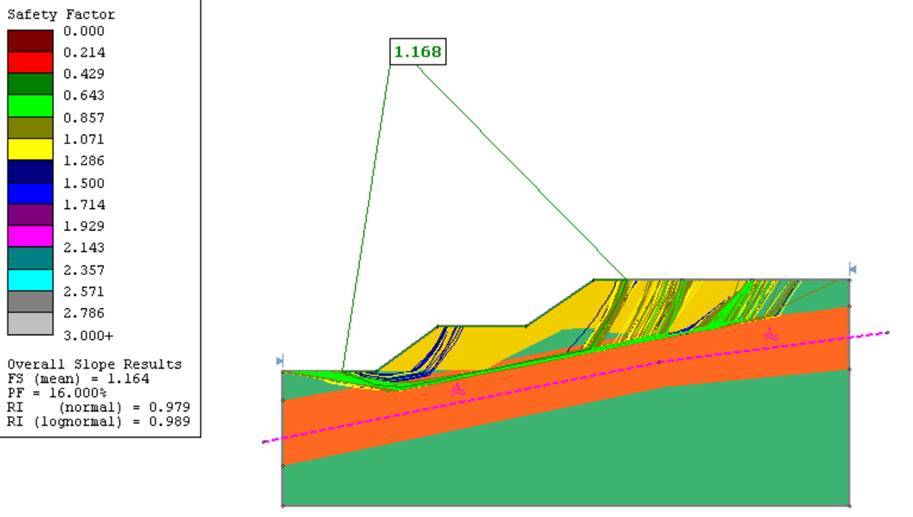
Defining Probabilistic Shear Strength using Coefficient of Variation (COV)
Previously, when performing a probabilistic analysis in Slide2 and Slide3, a user would define the soil using parameters such as cohesion and friction angle. They would enter a mean value as well as a range for that value to be considered. For users that don't have sufficient data on how much cohesion and friction angle (for example) might vary, a new feature has been introduced to allow the user to define the probabilistic shear strength using the Coefficient of Variation (COV).
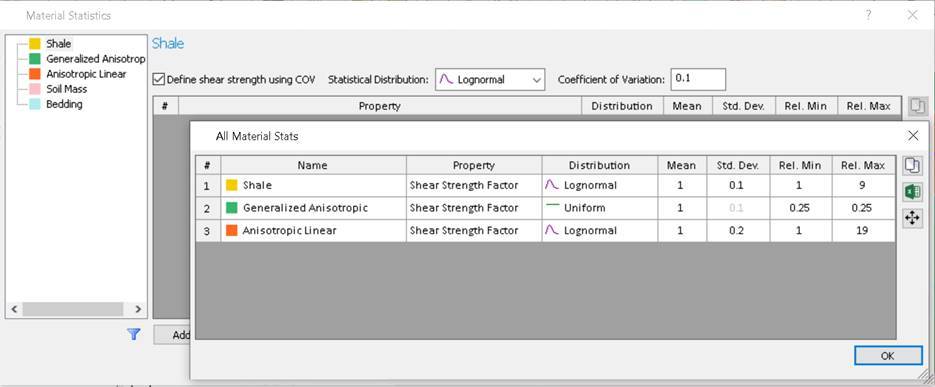
With COV, the strength for each strength type is calculated with an equation based on the input parameters, which can make things much simpler for users. This also means users can now do probabilistic analyses for all strength types (shear/normal, anisotropic, etc.)
June 2020
Adding to the library of Manufacturers and Support Products
Slide2 is a powerful 2D slope stability analysis program that uses the limit equilibrium method to evaluate the safety factor of circular and non-circular failure surfaces in soil or rock slopes. This easy to use program can create and analyze complex models and be used for all types of soil and rock slopes, embankments, earth dams, and retaining walls.
This year Slide2 introduced a new library of manufacturers and support products that could be added directly into your model, making designing support solutions faster and more precise. This list of support products has continued to grow. This month we are excited to announce a new addition to the list of Geosynthetic products: Geosintex’s EDILGRID – a high modulus polyester geogrid use for stabilization and soil reinforcement.
April 2020
Integrate Specific Geosynthetic Support Products
As part of the many Maintenance+ upgrades to Slide2, Rocscience is adding an exciting new feature where users can integrate specific geosynthetic support products into their slope stability design.
Geosynthetic reinforcements are a great tool for providing additional slope stability when constructing embankments on soft soil. This new feature makes it easy to add those reinforcements into a design by letting users choose from one of the most extensive lists of manufacturers and products on the market. The specifications for each product are built into the Slide2 software, resulting in an overall faster design process and more accurate slope stability analysis.
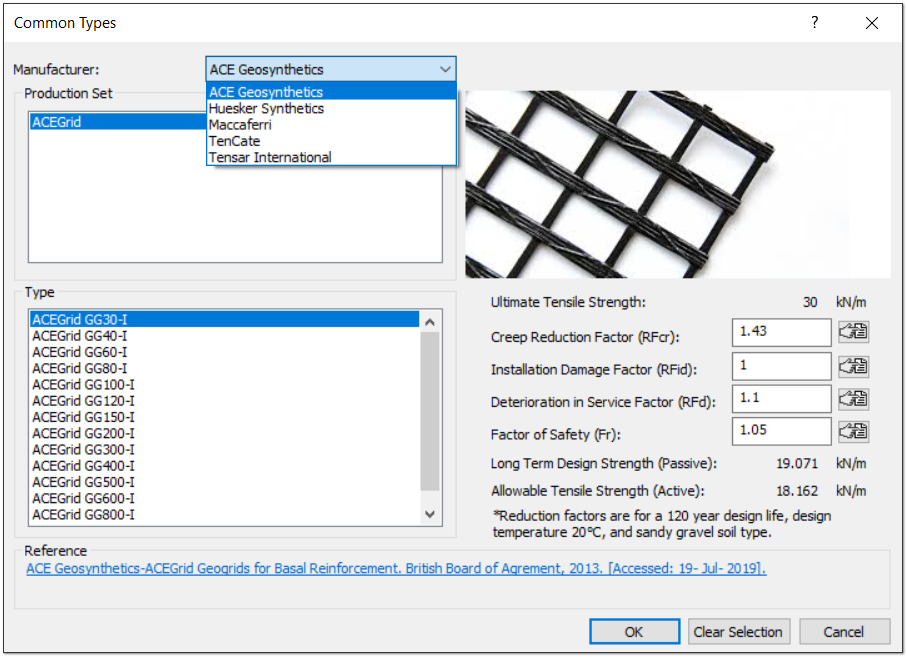
Rocscience has already partnered with several manufacturers for this including Maccaferri and Tensar International (available now in Slide3). This roster of companies now continues to grow with the addition of several new manufacturers including ACE Geosynthetics, Huesker Synthetics, and TenCate.
With these manufacturers come several new products available to be used in your design. ACE Geosynthetics brings their AceGrid GG - flexible woven PET geogrids used for soil reinforcement. Huesker Synthetics has two products available: the Fortrac - a highly resilient, flexible geogrid for soil reinforcement and the Stabilenka - one of the world’s strongest woven reinforcement fabric. TenCate has three products available including their Mirafi PET - a woven high-strength polyester geotextile, and the Miragrid GX and Miragrid XT - geogrids used for soil reinforcement in Mechanically Stabilized Earth (MSE) Walls and Reinforced Soil Slope (RSS) structures.
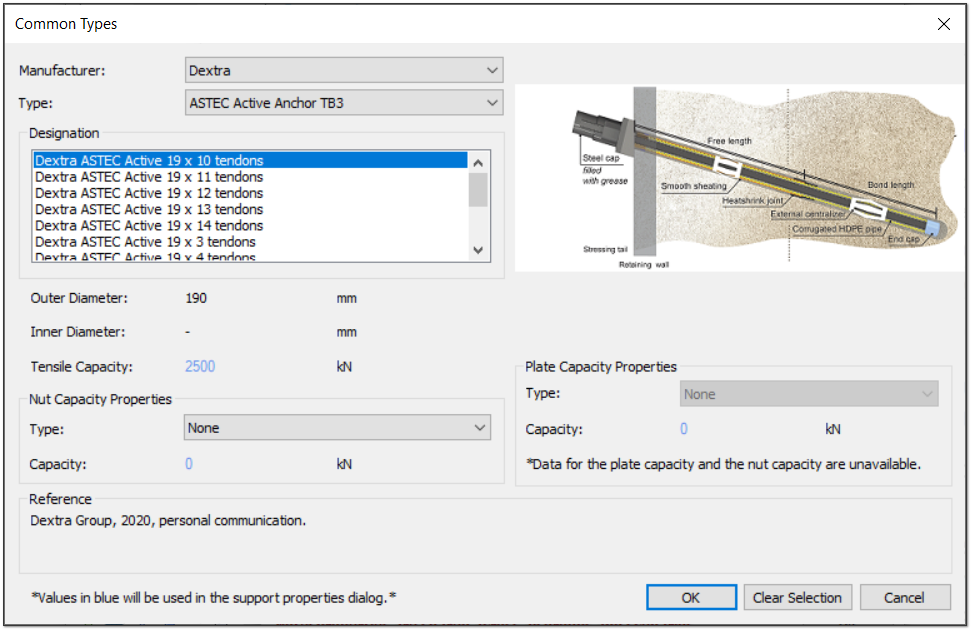
The list of manufactures doesn’t just apply to geosynthetics though. There are now several soil nail and grouted tieback products available from the manufacturer Dextra, including the GEOTEC GFRP Rockbolt, GEOTEC GFRP Self Drilling Anchor, and several more.
Import RSPile files into Slide2
The installation of piles is one of the most common methods of slope stabilization in the industry. This makes the general pile analysis software RSPile a particularly useful addition to your slope stability suite. The RSPile program allows users to design and analyze numerous types of piles to meet the needs of their geotechnical project including driven piles, axial and laterally loaded piles, and grouped piles. In the case of slope stability analyses, RSPile automatically calculates the pile resistance by allowing the user to specify the range of sliding depths examined in the analysis and producing the corresponding pile resistance functions.
These pile resistance functions produced in RSPile are easily imported into the Slide2 program. Simply open the Define Support Properties dialog and select RSPile as your support type. From here you can launch RSPile and import the RSPile file directly into Slide2.
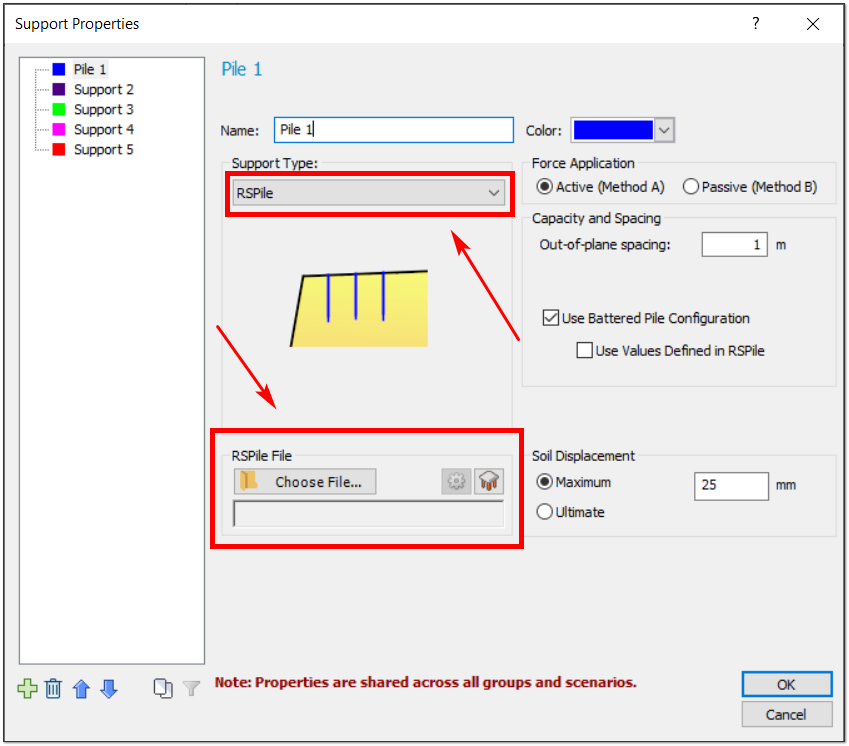
With one RSPile model file a user can define the soil and pile properties for multiple piles of various embedment lengths and soil layer configurations.
For each intersected slip surface to a pile, Slide2 will use linear interpolation to determine the appropriate resultant pile resistance and compute the factor of safety.
March 2020
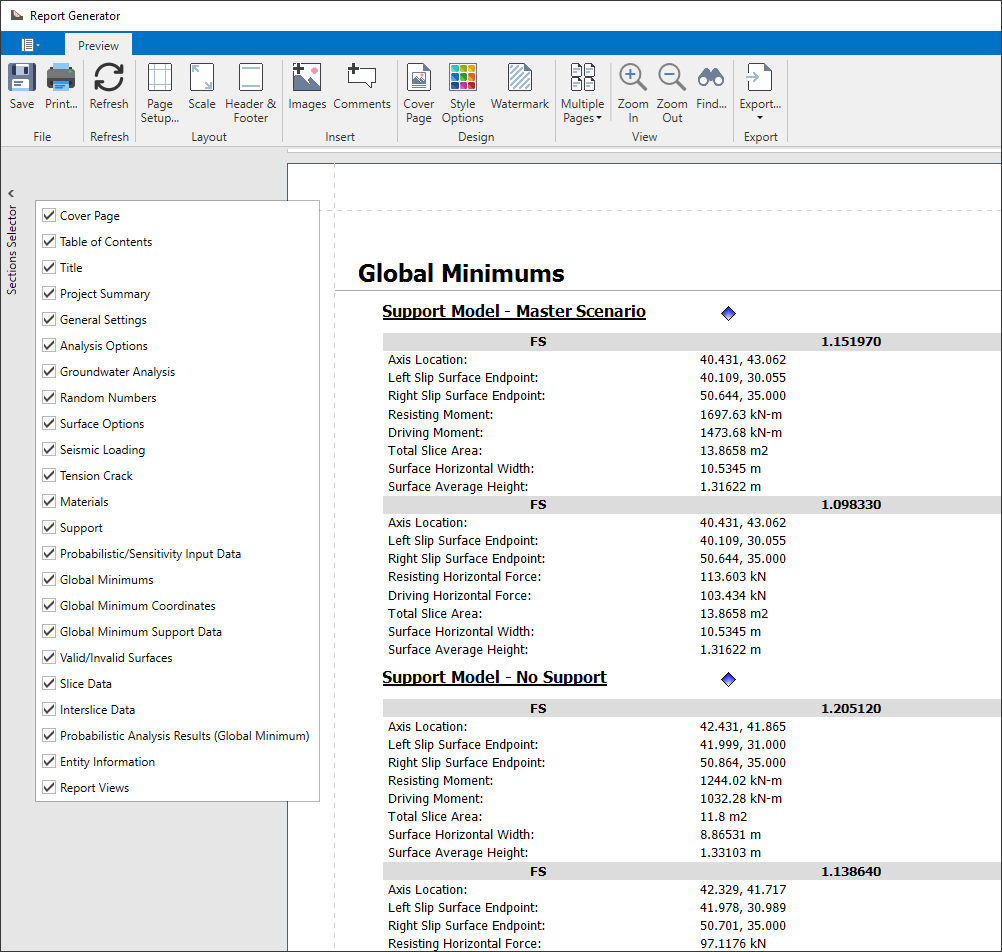
Report Generator
This spring, Rocscience is excited to announce the introduction of the Report Generator, a dynamic new reporting tool coming to some of Rocscience's most powerful programs, including Slide2 & Slide3, RS2 & RS3, and EX3. Formerly called the Info Viewer, this new reporting tool lets you create sleek, professional-looking reports for your geotechnical project.
When you launch the Report Generator it will automatically create a report of your analysis, and package it with a customizable cover page, table of contents, headers and footers, and so much more.
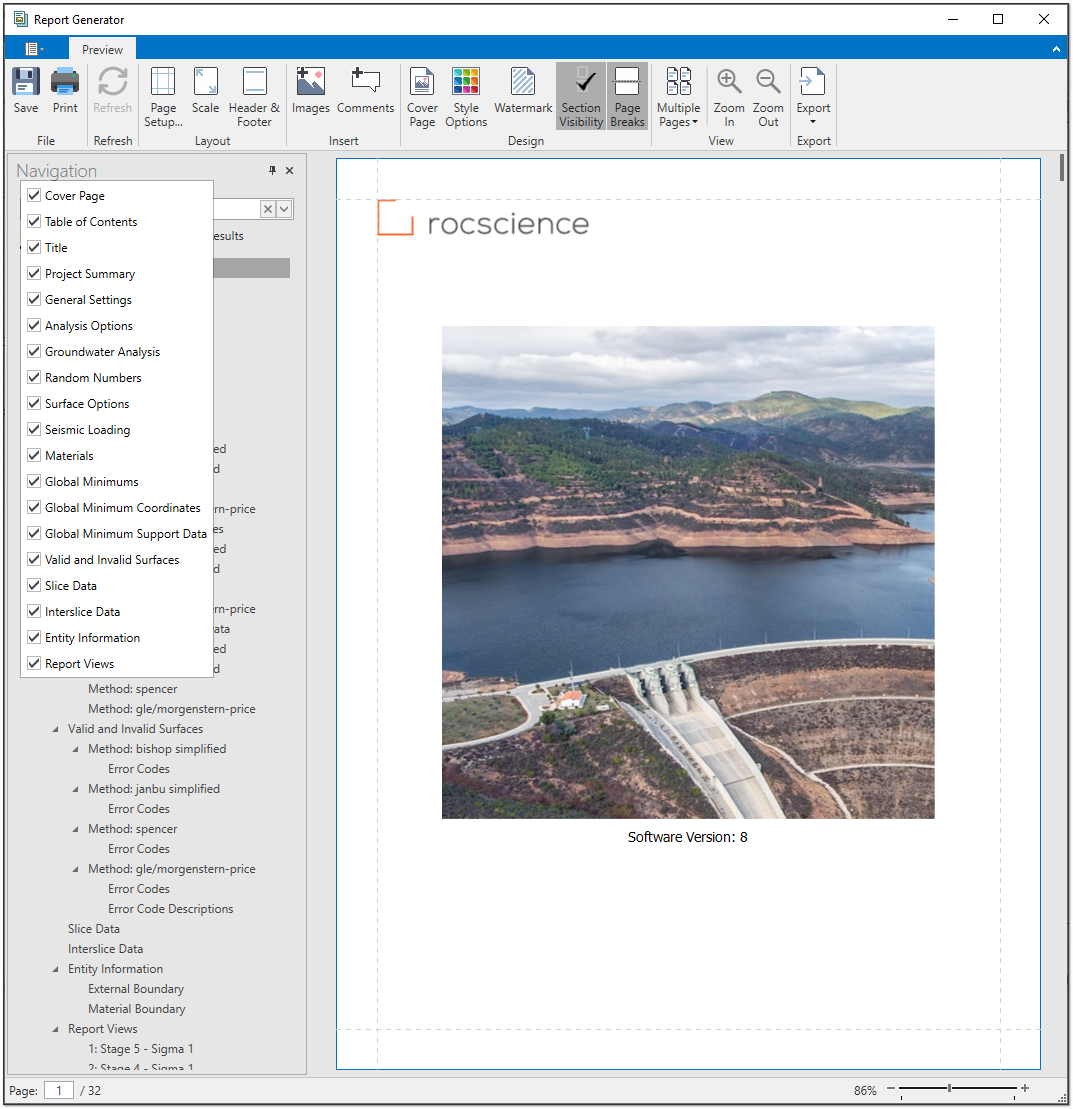
The Report Generator includes a navigation bar that lets you quickly navigate and search the report. Just click on the document map to view sections of the report or use the search bar to look for specific content. Included in the report is a table of contents that is automatically created and adjusted as you add and remove sections from your analysis.
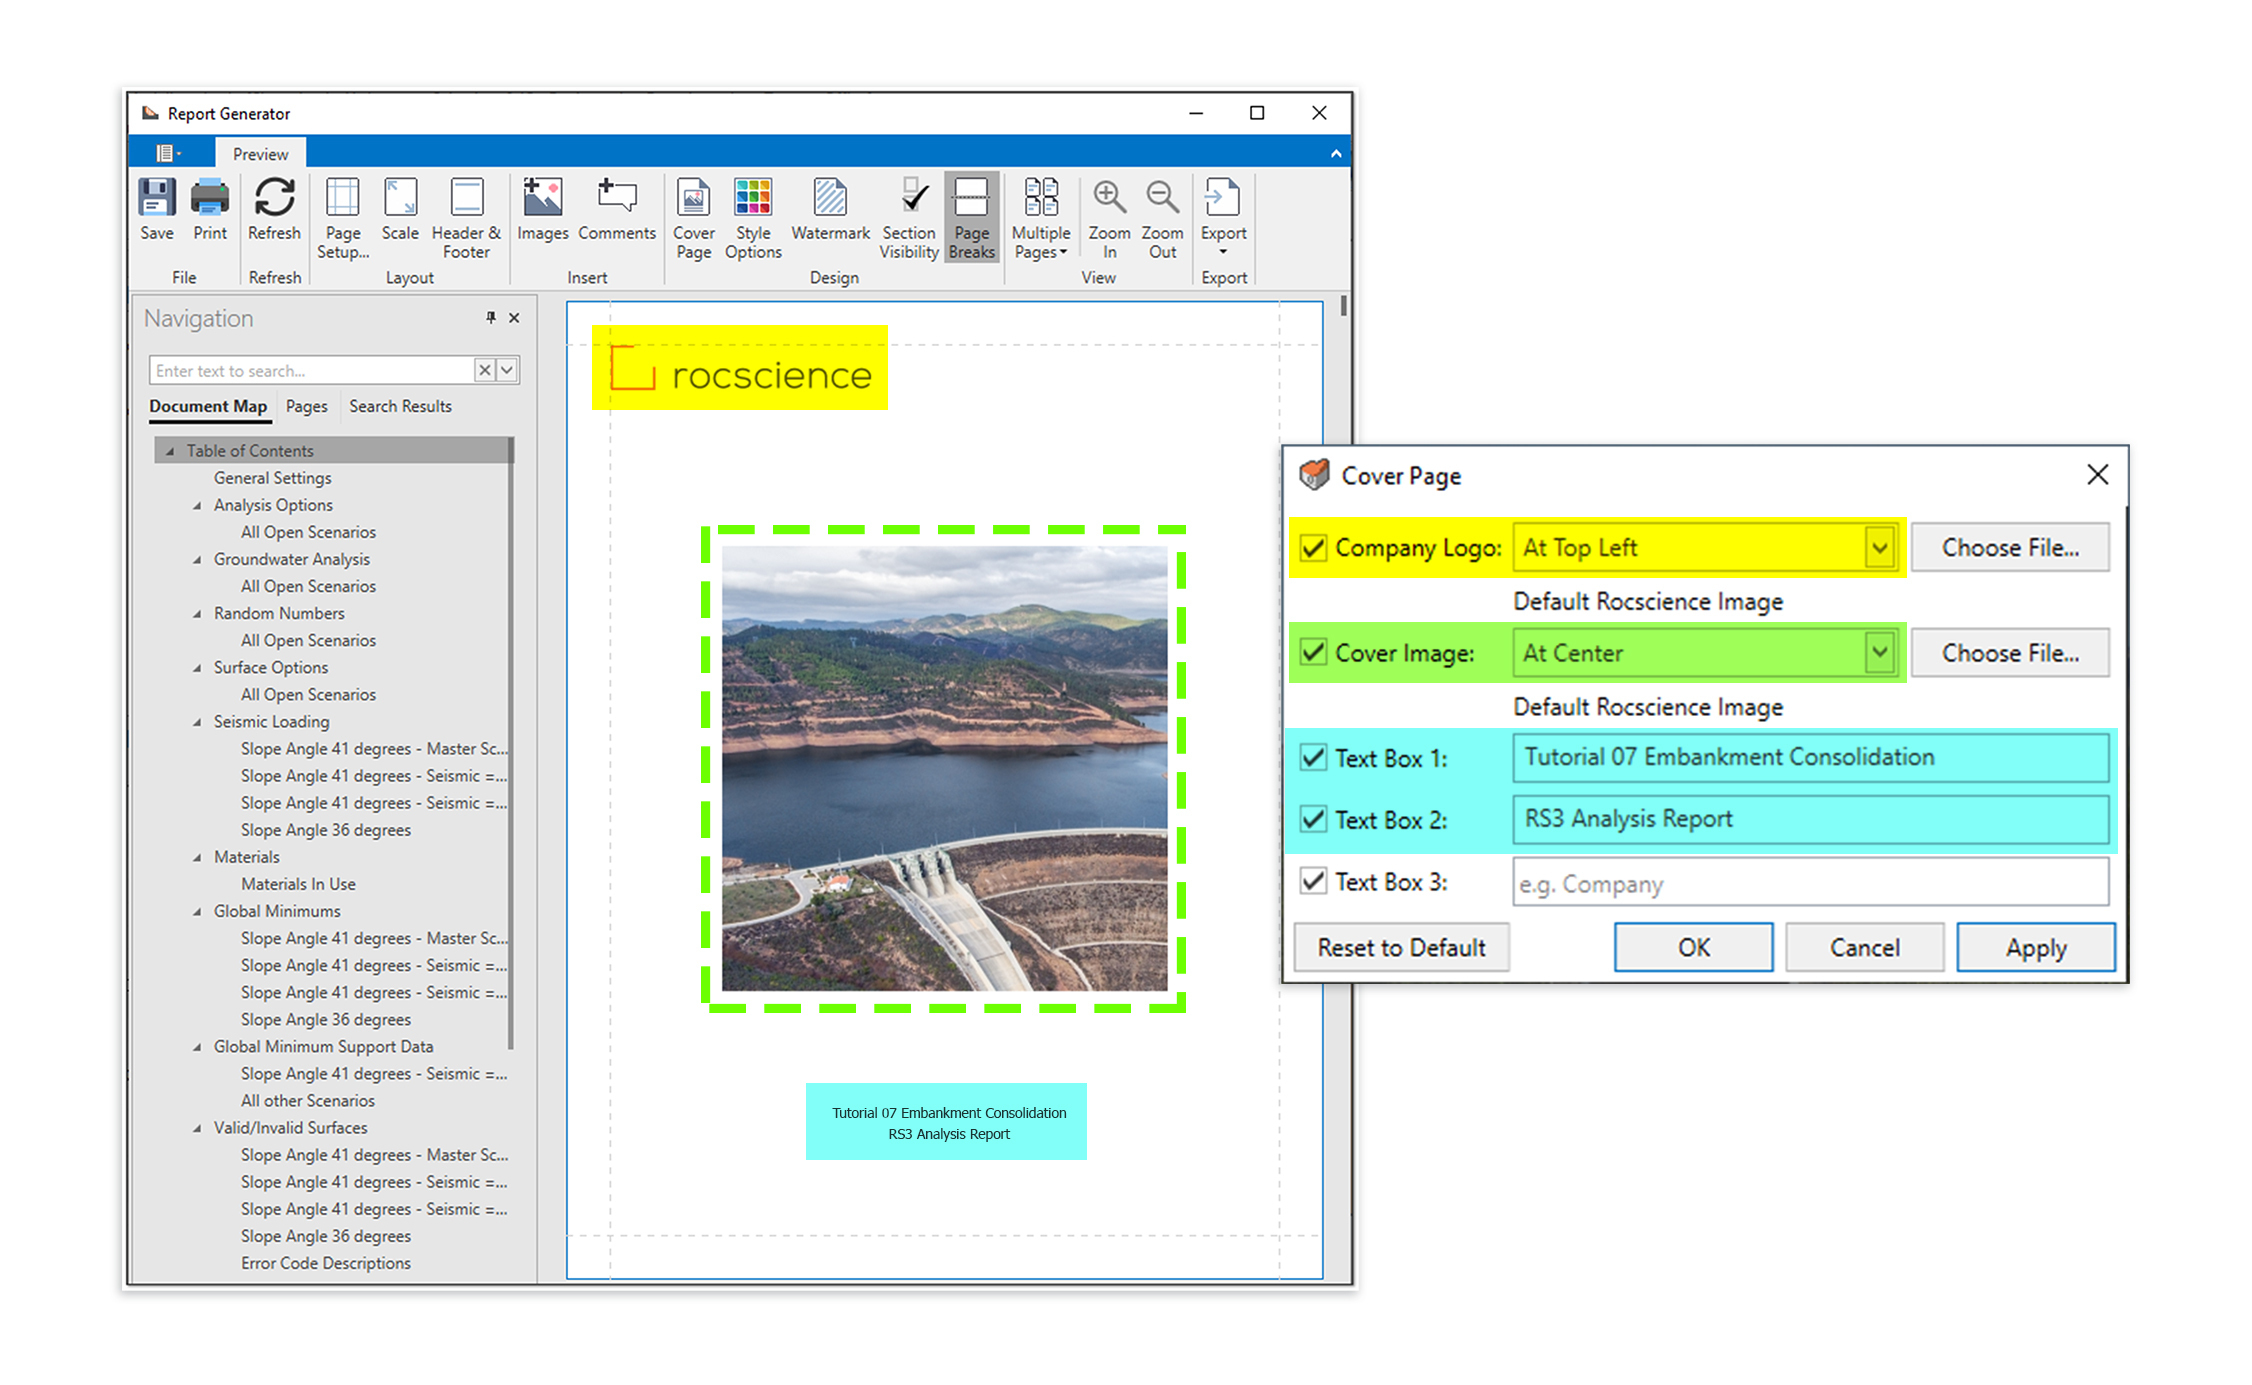
A sleek, editable cover page is automatically created for your report and can be customized with your own images, company logo, and more. Use the controls to easily adjust the layout and select what sections to include. Once you’re happy with the look of your cover page, you can save time by saving these customizations for use on future projects.
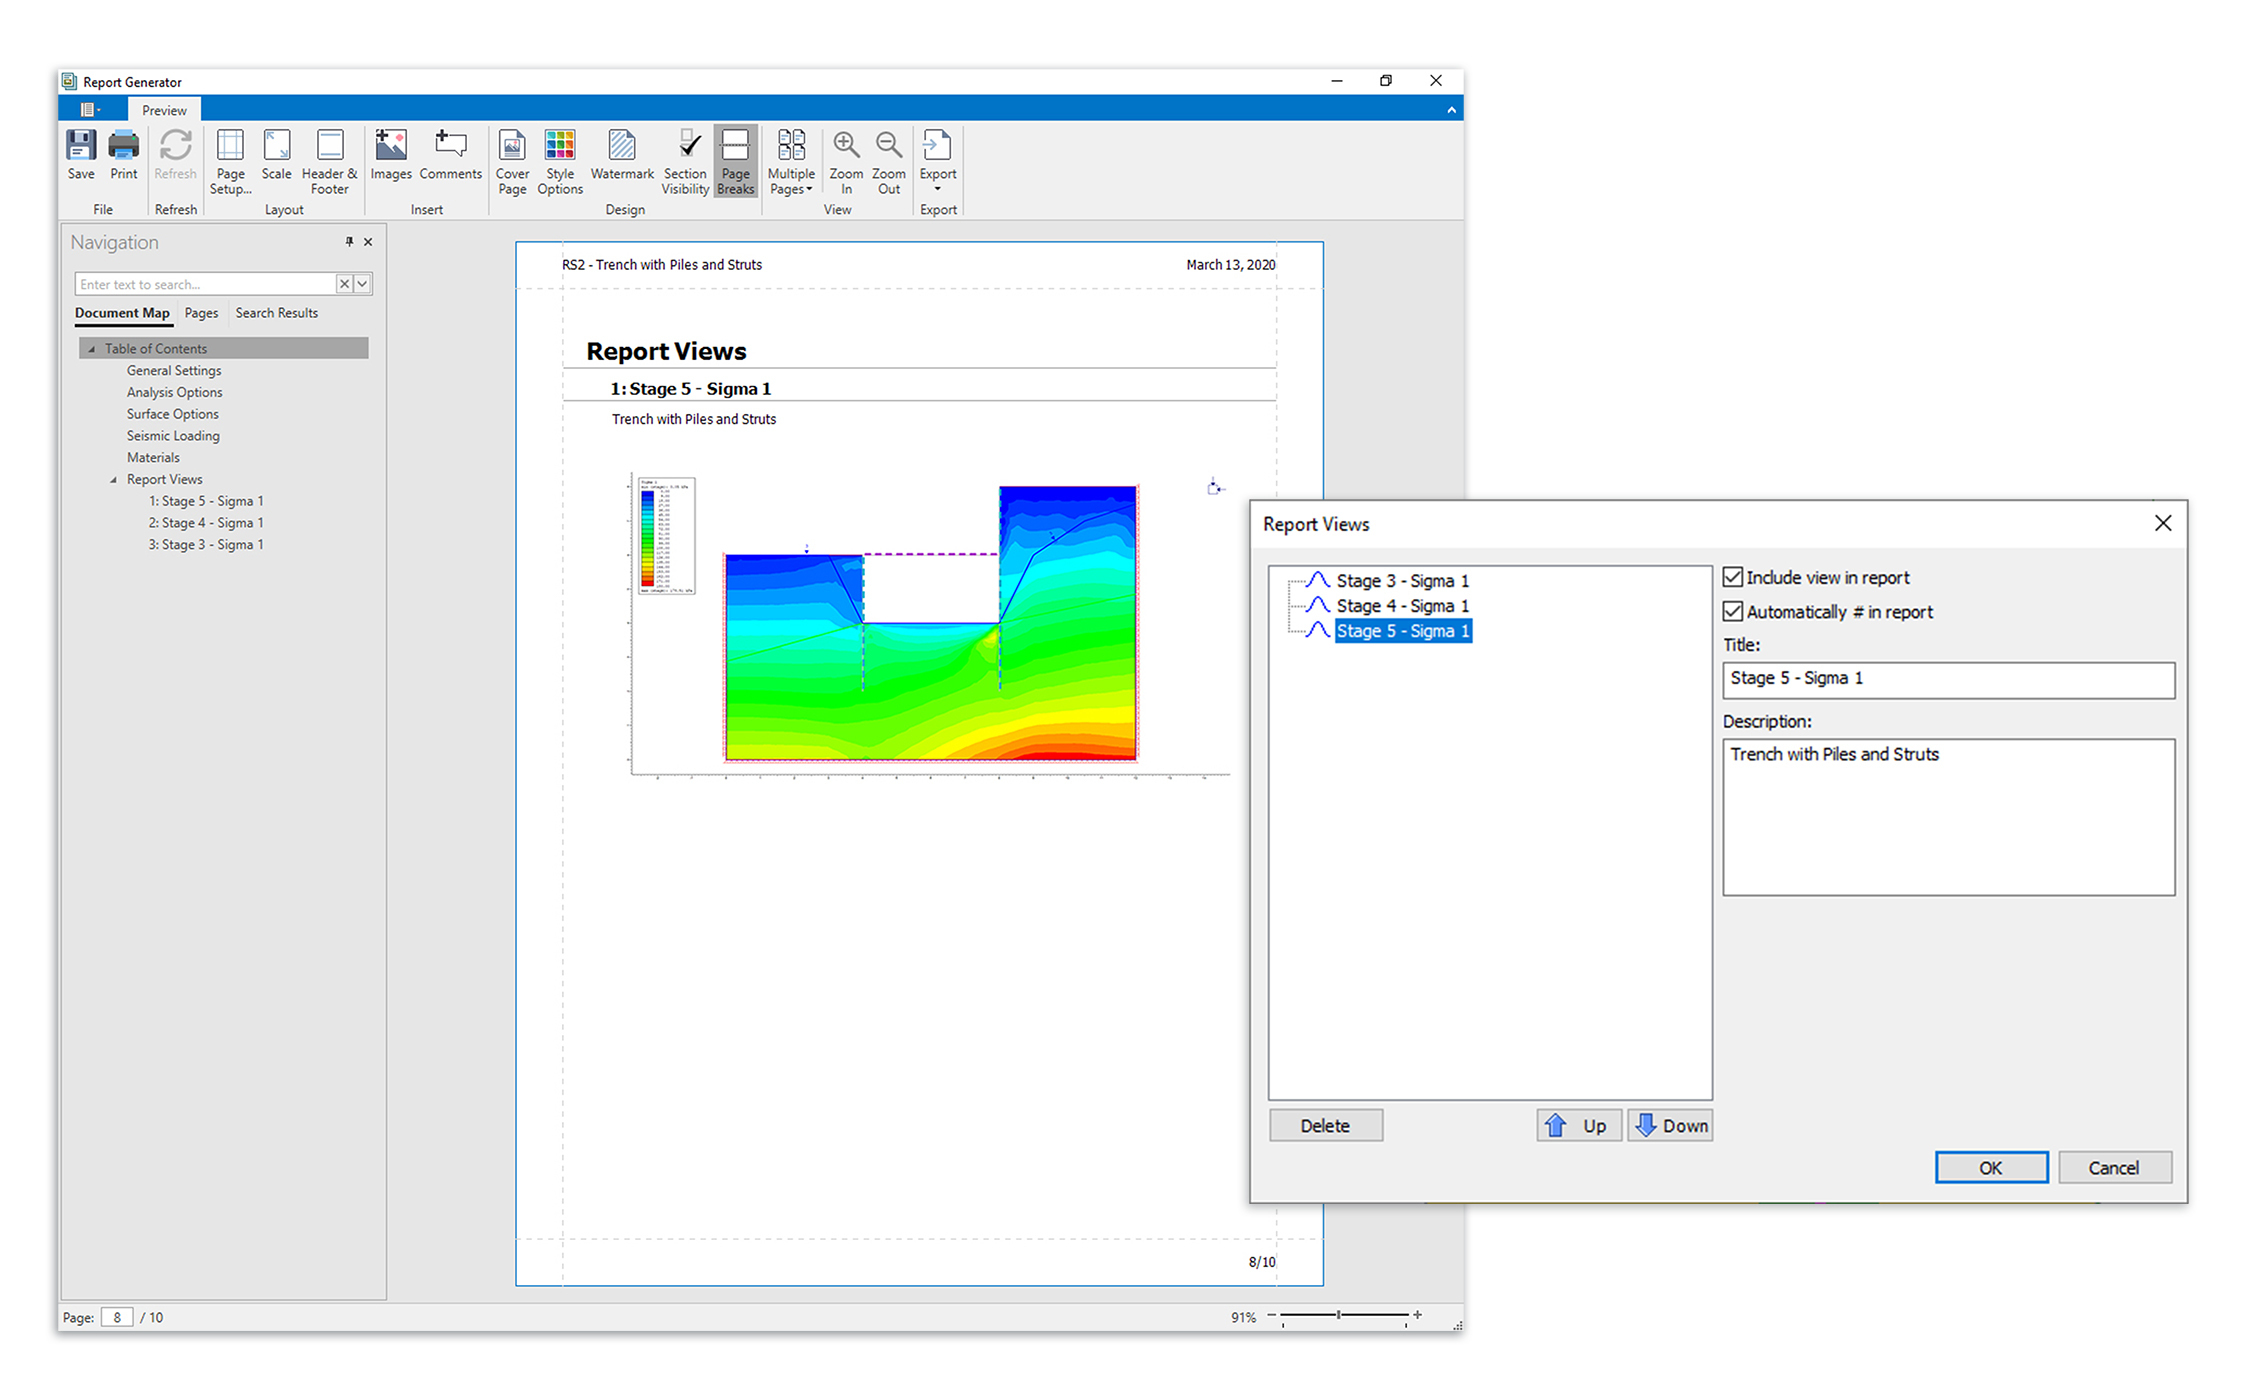
With the Report Generator you can edit more than just the look of your report though. You can also add content of your own! Use the Add Images or Add Comments buttons to add text and images to any section of the report. If you want to add snapshots of the computed model, you can do that as well from the Interpret window of your Rocscience program. The tool lets you add multiples views of your model, add titles and descriptions, and even arrange the order of the views. The views of the model will then be added to the end of your report.
Once you’re done customizing your report, you can easily print or export the file.
February 2020
Reporting Done Right: Batch Printing And The New Report Generator
At Rocscience we talk a lot about the analytical capabilities of our software programs, but what about what happens after you’ve computed your results? When it comes to customizing and printing your reports, Slide2 has got you covered with its new Batch Printing feature and Report Generator.
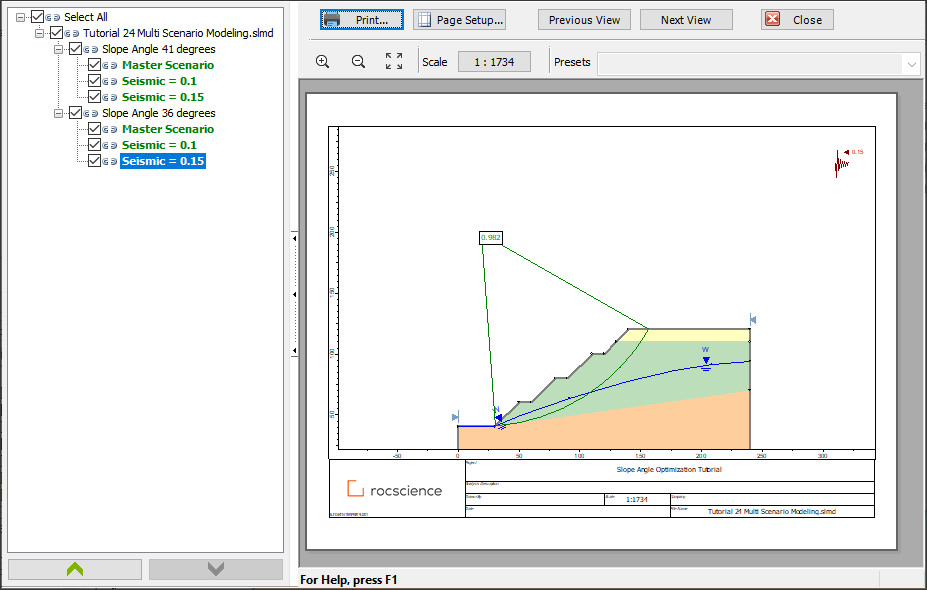
The new Batch Printing feature is the perfect companion to Slide2’s multi-scenario modelling tool. Slide2 users already have the advantage of being able to compute the results of several different scenarios at once, and now with the batch printing feature, you can select, organize and print the results of your multiple scenarios all in one batch. Just click print as per usual and check the checkboxes for the scenarios you want to include in your batch.
In addition to the Batch Printing, the Info Viewer for Slide2 has gotten a serious upgrade. Now called the Report Generator, this new tool lets you customize the look and feel of your report like never before. You can add images, comments, select the sections you want to include, customize headers and footers and so much more. Once you’re done customizing your report, Slide2 has new export options that now include both HTML and PDF options.
Common Types of Geosynthetic Supports Now Available Within Slide2
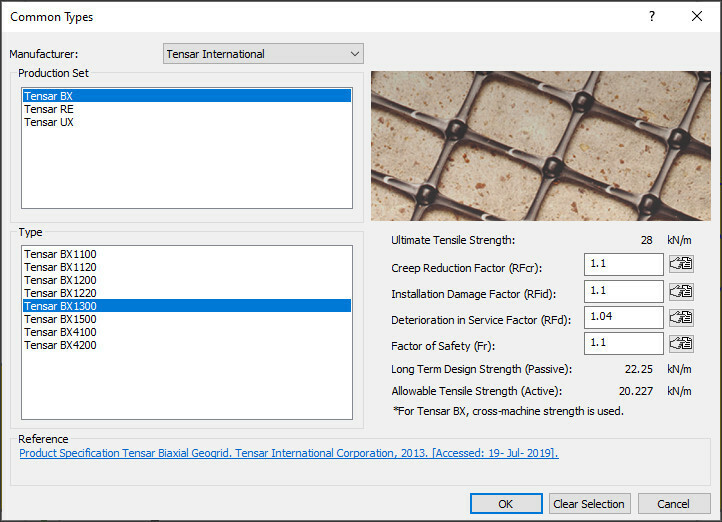
This year Rocscience has partnered with several prominent manufacturers, including Maccaferri, Tensar and more, to make adding geosynthetic supports to your design even easier than before. When selecting geosynthetics as your support type, you will now be able to select from a list of commonly used geosynthetic support products. The properties of the selected geosynthetic will be automatically populated and a link will be provided to manufacturer spec sheet for even more details on your selected geosynthetic.
Slide2 users aren’t the only ones that get to enjoy this new feature though. This list of common geosynthetic supports will also be available in Slide3 and the upcoming release of RS2, so keep an eye out for that.
Sampling Method Added For Probabilistic Analysis: Response Surface
A new, faster sampling method for probabilistic analysis is being added to Slide2 this month: the Response Surface method. Overall, slope probabilistic analysis can take a long time to compute for complex models. With the Response Surface method though, a small sample of strategically selected cases are computed and the other cases are predicted. The result of using this method is that it can save a lot of computation time for users wanting to do a quick analysis.
The figures above show an example of two slope probabilistic analyses, one using the Latin-Hypercube method and the other the Response Surface method. In this example the Response Surface Method computes three times faster than the Latin-Hypercube, saving the user an hour of computation time.
November 2019
Added Tensar Geogrids
Rocscience Inc. is pleased to announce the inclusion of Tensar Uniaxial (UX) Geogrids in the new Slide2. Easy to handle and install, Tensar UX Geogrids are used for high-strength soil reinforcement in wall and slope applications.
Tensar® Uniaxial (UX) Geogrids, from Tensar International Corporation, are manufactured from select grades of high-density polyethylene (HDPE) resins that are highly oriented and are designed to resist elongation (creep) when subjected to heavy loads for long periods of time. These geogrids are also highly resistant to installation damage as well as long-term chemical or biological degradation.
This partnership with Tensar means Rocscience will continue to deliver to its customers the most comprehensive and practical solutions through its offering of Slide2 and Slide3. Slide2 is the world’s most powerful, user-friendly 2D slope stability analysis program using the Limit Equilibrium Method. Slide3 is a tool that allows geotechnical engineers to calculate the Factor of Safety of complex 3D slope stability geometries that 2D models cannot fully simulate.
On the integration, Rocscience President Dr. Thamer Yacoub had this to say:
This addition to Slide2’s collection of pre-defined support types once again meets our customers’ need for comprehensive and practical 2D slope stability analysis solutions for rock and soil. We know our customers want programs that are easy to use so they can focus on what’s important—the analysis.
And as Tensar put it:
Tensar is pleased to have its Uniaxial (UX) Geogrids featured as support options within the latest version of Slide. Tensar UX Geogrids provide high-tensile strength at low strains for use in mechanically stabilized earth walls and reinforced soil slopes, backed by the most thorough quality assurance practices. When you stabilize your vertical earth structure with Tensar UX Geogrids, you can have full confidence that your model is based on technology, experience and expertise that have set the industry standard for more than three decades.
Added Macaferri Paramesh System
Rocscience Inc. is excited to announce the addition of the Maccaferri Paramesh system to Slide2 and Slide3. Paramesh, from Officine Maccaferri, is the most advanced solution for retaining walls and soil reinforcement consisting of Terramesh® units with Paraproduct soil reinforcement geogrids.
The renowned Maccaferri Terramesh system is a modular system used to form rock-faced reinforced soil walls (also known as Mechanically Stabilized Earth walls) and embankments. It has been used globally on some of the most significant infrastructure schemes, including what is believed to be the tallest reinforced soil structure in the world at 74m high. Terramesh units can be used in conjunction with Maccaferri Paraproduct high-performance polymeric geogrids, ParaLink®, ParaGrid®, and MacGrid® WG.
Benefits of the Paramesh system include flexibility, durability, fast and safe installation, and environmental friendliness, as well as certification and testing by leading international institutes in accordance with the latest guidance and standards.
This partnership with Maccaferri means Rocscience will continue to meet the demands of its clients for high quality and value through its offering of Slide2 and Slide3. Slide2 is the world’s most powerful, user-friendly 2D slope stability analysis program using the Limit Equilibrium Method. Slide3 is a tool that allows geotechnical engineers to calculate the Factor of Safety of complex 3D slope stability geometries that 2D models cannot fully simulate.
On the integration, Rocscience President, Dr. Thamer Yacoub, had this to say:
This addition of Maccaferri Paramesh to Slide2 and Slide3 means our customers now have access to an even more comprehensive collection of pre-defined support types. We know our customers want practical easy-to-use products they can count on so they can focus on what’s important—the analysis. This enhancement is just one more way that we meet that need.
And as Maccaferri Product Marketing Manager Settimo De Cario put it:
Construction clients within the infrastructure, mining and environmental sectors are demanding greater performance from the solutions they procure. They require a longer design life, reduced maintenance commitment, greater value and a lower environmental impact. Maccaferri Terramesh and ParaProducts, now available on Rocscience Slide2, address all these demands.
Indeed, Maccaferri Terramesh and ParaProducts are amongst the most tried and tested double twisted steel wire meshes and geogrids in the world offering 120 year design life and high performance with clear and transparent communication of the environmental impacts.
June 2018
Load Resistance Factor Design
Rocscience is excited to announce the addition of the load resistance factor design (LRFD) approach to slope reinforcement in the upcoming update to Slide2. LRFD has been gaining traction in past years, with more departments of transportation and the Federal Highway Administration (FHWA) adopting this method of analysis in response to federal and state compliance requirements.
Rocscience worked with several departments of transportation in the USA to develop a general method of applying partial factors to slope support elements that would work with the varying ways in which these factors are applied by different companies and organizations.
How LRFD works in Slide2
We’ve added a Partial Factors button to the Define Support Properties dialog (Figure 1 below) to enable input of LRFD factors corresponding to the failure modes applicable to each Support Type.
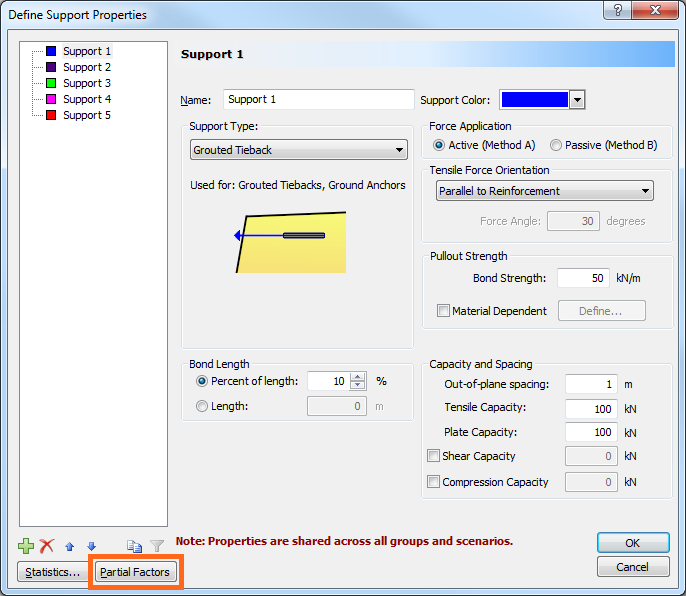
For example, when selecting Grouted Tieback as the Support Type, clicking the Partial Factors button opens the Support – Partial Factors dialog (Figure 2 below), providing factor inputs for all four corresponding failure modes since all are applicable to that type. When the support forces applied to the model are calculated, they’re automatically divided by the factor values entered in the dialog.
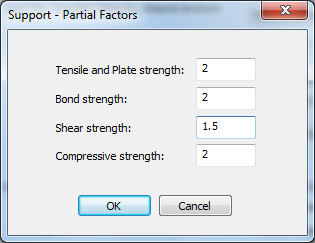
Table 1 below displays the factors that are available for each Support Type, based on the applicable corresponding failure modes.
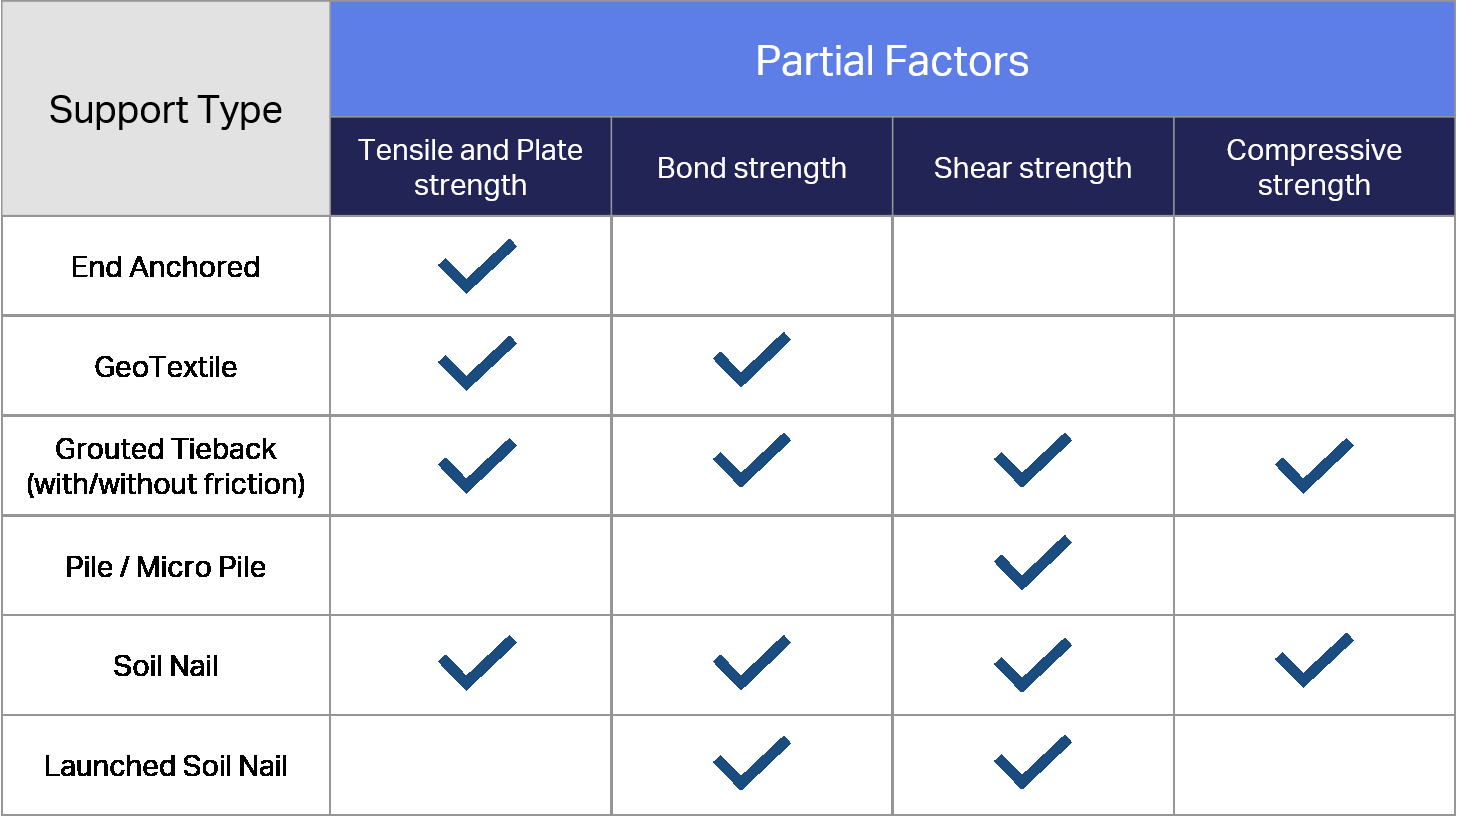
Note that the Partial Factors option is not available for the RSPile type or the User Defined type.
Learn Slide2
Explore the Slide2 user guide for in-depth instructions on how to use the program and visit our library of learning resources which includes case studies, past webinars, and articles, designed to expand your geotechnical knowledge and help you get the most out of your analysis.