Joint Strength
If you are performing a Probabilistic analysis with SWedge, the Joint Shear Strength can be defined as a random variable, as follows:
- Select Input Data
 and select the Strength1 or Strength2 tab in the Probabilistic Input Data dialog to define the shear strength for Joint1 or Joint2.
 - Select the shear strength model - Mohr-Coulomb, Barton-Bandis or Power Curve.
- There are two different methods of defining shear strength as a random variable in SWedge:
- Parameters
- Strength
- Enter the probabilistic shear strength parameters as described below.
See below for information about these options.
Random Variables (Strength Parameters)
If the Random Variables option = Parameters, then you can define a statistical distribution for EACH PARAMETER used in the strength criterion (i.e. c and phi for Mohr-Coulomb; JRC, JCS and phir for Barton-Bandis; a, b, c, d for Power Curve).
CORRELATION COEFFICIENT
If you are using the Mohr-Coulomb strength model, then you can define a correlation coefficient between cohesion and friction angle. See the Correlation Coefficient topic for details.
If you are using the Barton-Bandis or Power Curve strength models, then you can NOT define the correlation between the statistical sampling of the strength parameters (i.e. the statistical sampling of each parameter is performed independently of the sampling of any other random variables).
Random Variables (Shear Strength)
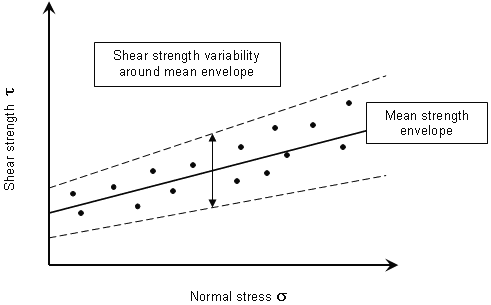
If the Random Variables option = Strength, then the shear strength (tau) is defined directly as a random variable, rather than defining the individual parameters of the strength criterion as random variables. For a given normal stress, a random value of shear strength will be generated. This works as follows:
- Set the Random Variables option = Strength.
- Enter the mean values of the strength criterion parameters (e.g. cohesion and friction angle for the Mohr-Coulomb criterion).
- Choose a statistical distribution for the shear strength. Only Lognormal and Gamma distributions are allowed, because these distributions are only defined for positive values, and therefore ensure that randomly generated values of shear strength will always be positive.
- Enter the Coefficient of Variation for the shear strength. The Coefficient of Variation is equal to the standard deviation divided by the mean shear strength.
- When the probabilistic SWedge analysis is computed, random values of shear strength are generated as follows:
- The normal stress on a joint plane is computed.
- Using the mean values of the strength criterion parameters (e.g. cohesion and friction angle), the mean shear strength is calculated. This defines a point on the mean strength envelope.
- Using the mean shear strength, coefficient of variation, and the selected statistical distribution (Lognormal or Gamma), a random value of shear strength is generated, for the given normal stress. This will be the actual value of shear strength used in the SWedge safety factor calculation.
- The above steps are repeated for each probabilistic simulation until the required number of samples are generated.

 = standard deviation of shear strength,
  = mean shear strength.
The random shear strength option is schematically illustrated in the following figure, for the Mohr-Coulomb criterion. Essentially, you are defining a variability of shear strength about the mean strength envelope. This is intuitively simpler to grasp than defining variability of individual strength parameters.
The random shear strength option is particularly useful for Barton-Bandis or Power Curve strength models since it eliminates the need for defining statistical distributions for individual strength parameters (which may be difficult to obtain or unavailable). Furthermore, the issue of statistical correlation of the strength parameters is avoided (i.e. you do not have to worry about generating unrealistic combinations of strength parameters, since variability is defined with respect to the mean envelope).
