9 - Overall Slope Reliability
1.0 Introduction
This tutorial will demonstrate Probabilistic Analysis using the Overall Slope Method.
With the Overall Slope Method, the ENTIRE SEARCH for a Global Minimum slip surface is repeated for every combination of random inputs generated, i.e., the global minimum is determined N times (where N = Number of Samples). This means that a new set of random variable samples is first loaded, and then a conventional critical failure surface search is carried out, in every simulation.
The current search will generate 1000 (the tutorial number of samples) Global Minimum slip surfaces.
The Overall Slope method takes greater computation time than the Global Minimum. Depending on the ‘Number of Samples’ and the complexity of your model, it can take several hours.
To learn more about computing Multiple files in Slide2, check out Compute help page.
When running a Probabilistic Analysis with Spatial Variability, the Overall Slope option is selected by default to account for the changing material properties.
The finished product of this tutorial can be found in the Tutorial 09 Overall Slope Reliability.slmd data file. All tutorial files installed with Slide2 can be accessed by selecting File > Recent Folders > Tutorials Folder from the Slide2 main menu.
2.0 Model Geometry
- Go to File > Recent Folders > Tutorials Folder and open the Tutorial 09 Overall Slope Reliability.slmd file.
Since the model is already completed, we will note the significant features of the model and then view the analysis results.
2.1 Project Settings
The Overall Slope Probabilistic Analysis option is set in the Project Settings dialog:
- Select Analysis > Project Settings

The Probabilistic Analysis type is set at Overall Slope.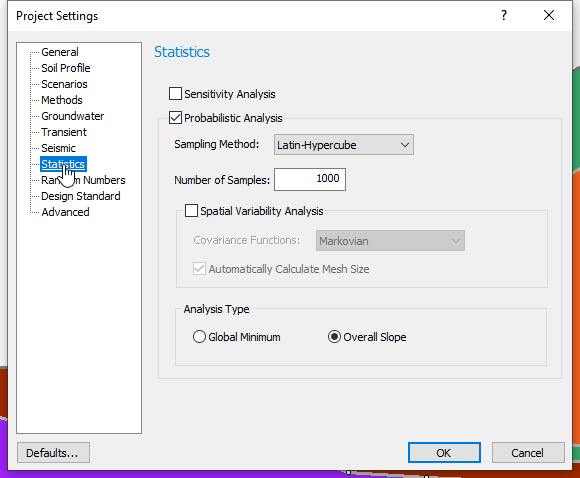
- Click Cancel to close the dialog.
2.2 Material Statistics
- Select Statistics > Define Materials
 to open the Material Statistics dialog.
 - Click on the Show All button to view the statistical parameters of the model. All the variables have a normal distribution.
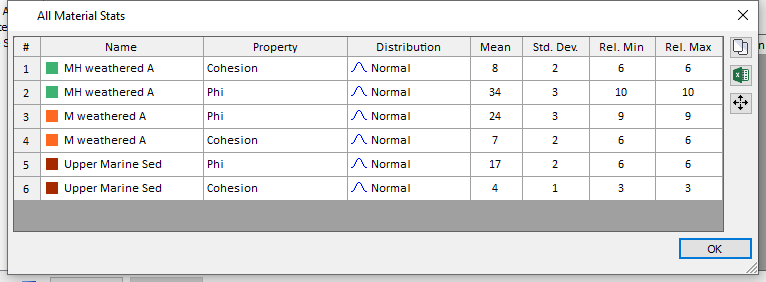
- Click OK to close the dialog.
- Select the Correlation button on the Material Statistics dialog.
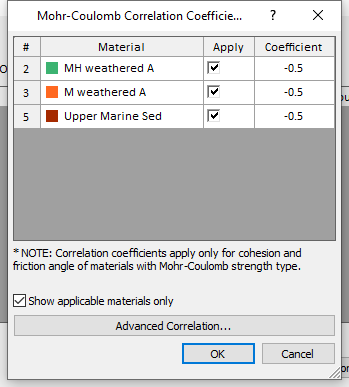
A correlation coefficient of –0.5 has been applied for each material, to ensure that the Cohesion and Friction Angle of each material, are correlated during the statistical sampling. - Click Cancel in both dialogs.
- Select Surfaces > Surface Options

2.3 Surface Options
We will run a Circular surface search using the Slope Search method.
3.0 Compute
- Select Analysis > Compute
 to run the analysis. This will only take a few seconds because of the model setup.
4.0 Interpret
- Select Analysis > Interpret
 to view results when computations are done.
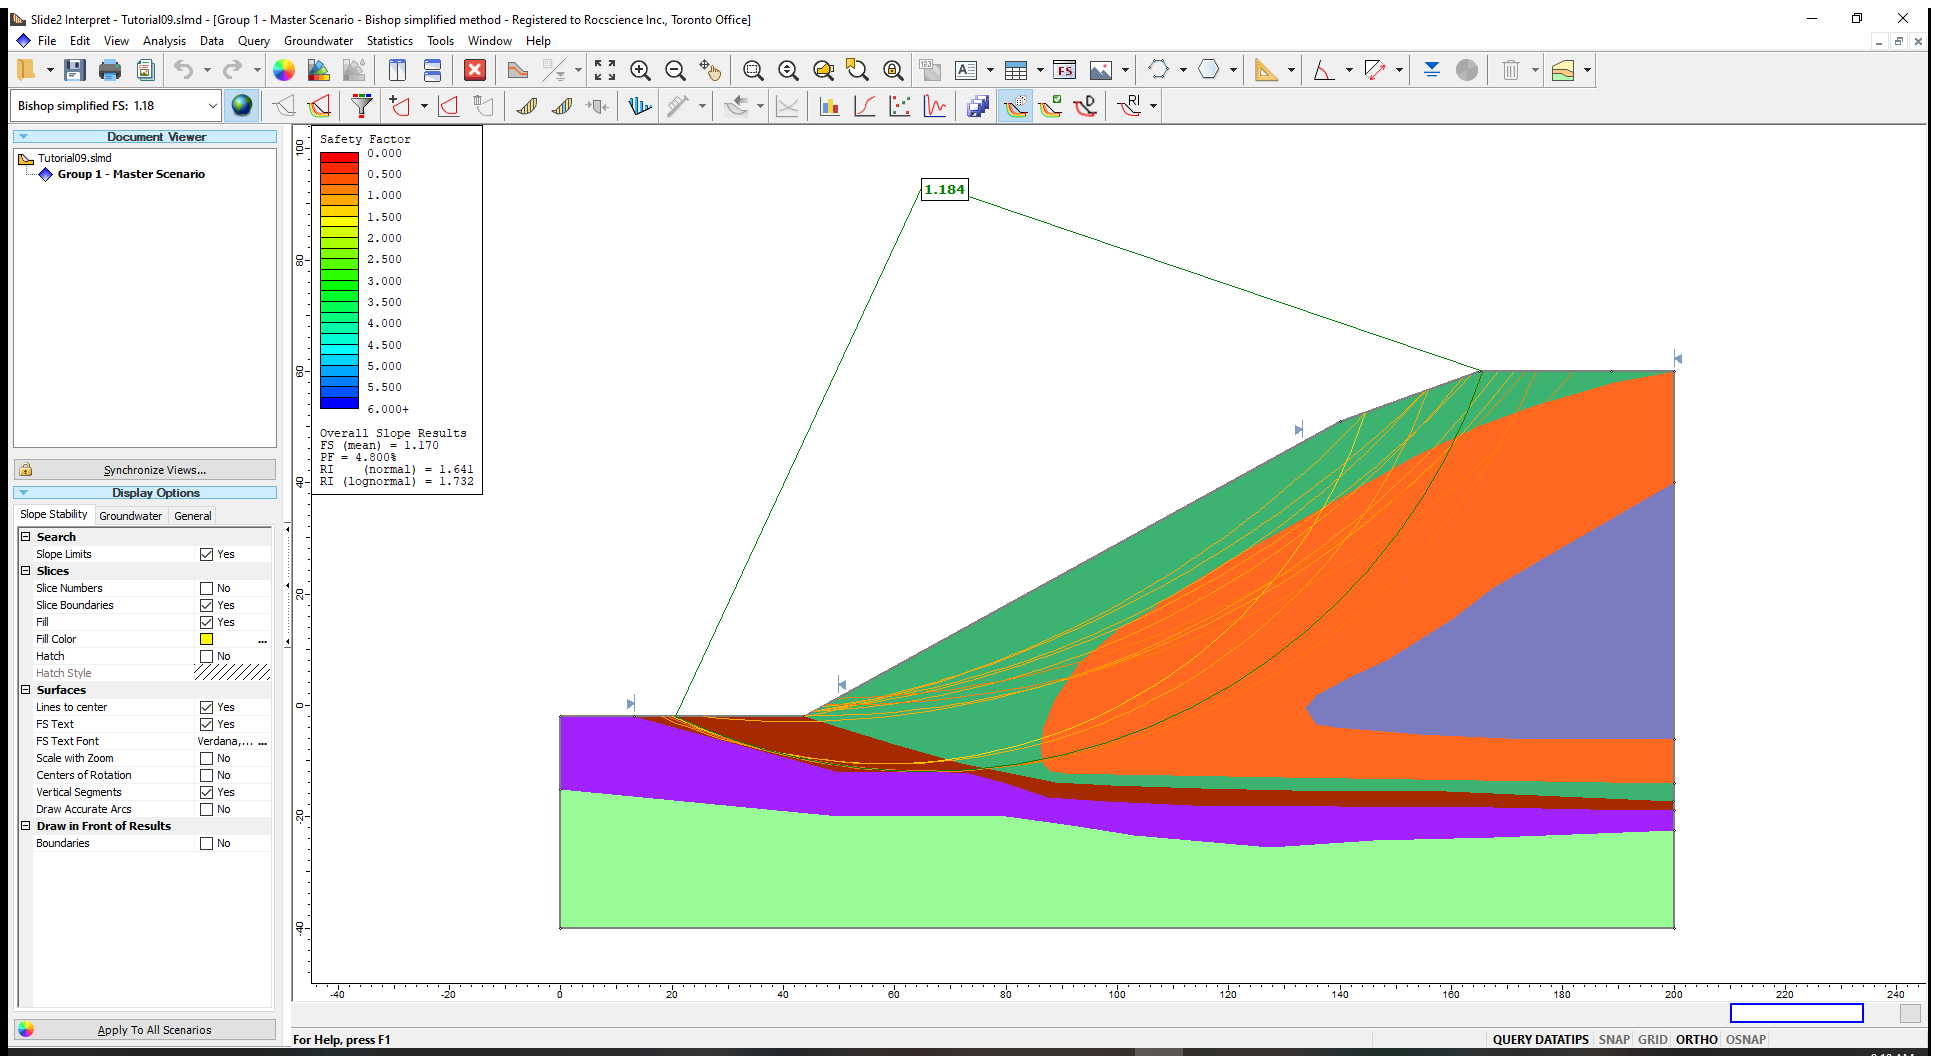
The Overall Slope results (FS mean, PF and RI) are displayed on the Safety Factor Legend at the top left corner of the modeling view. The deterministic safety factor of 1.18 with its corresponding slip surface is also displayed on the model.
The different Global Minimum (GM) surfaces located are also shown on the model. The Global Minimum surfaces can be turned OFF by:
- De-selecting the option at Statistics > Show GM Surfaces or by clicking the Show GM Surfaces
 icon in the toolbar.
Notice that the Legend with the overall slope results also disappears when you de-select the ‘Show GM Surfaces’ feature.
The slip surfaces displayed by the ‘Show GM Surfaces’ option represent all the different Global Minimum slip surfaces, which were located by the Overall Slope probabilistic analysis.
In general, each of these slip surfaces will correspond to multiple runs of the probabilistic analysis. The actual number of runs of the probabilistic analysis which correspond to each Global Minimum slip surface, can be interactively viewed as a data tip by hovering the mouse over any surface.
To view this data:
- Toggle the Data Tips option until either Min Datatips or Max Datatips is displayed. (Data Tips can also be toggled in the View menu.)
- Hover the mouse over any GM slip surface.
When you hover the mouse on the lowest slip surface, it indicates that 7.0% of the analyses (70 / 1000) resulted in the location of that slip surface as the Global Minimum surface. The range of safety factors for the slip surface is also displayed.
When a slip surface displayed by the Show GM Surfaces option has a relatively large number of corresponding analyses, this surface should be given the appropriate consideration in the slope design.
Conversely, some of the slip surfaces displayed by the Show GM Surfaces option may only correspond to one or two analyses. This would indicate a very small probability of that surface occurring as a potential failure surface.
Two important results derived from an Overall Slope Probabilistic Analysis are:
- Overall Slope Reliability
- Critical Probabilistic Surface
4.1 Overall Slope Reliability
The Overall Slope Reliability is based on the distribution of safety factors obtained from all the Global Minimum slip surfaces located by the analysis.
The Overall Slope Reliability is not associated with a specific slip surface. Instead, its results (Probability of failure and Reliability Index) are considered as truly representative of the entire slope.
In general, the Overall Slope Results will give the LOWEST Reliability Index (and the HIGHEST Probability of Failure) when compared to Global Minimum results, because “failure” can occur along any surface on the slope. The analysis is not restricted to a single slip surface.
4.2 Critical Probabilistic Surface
The Critical Probabilistic Surface is the individual slip surface which has the Minimum Reliability Index (and the maximum Probability of Failure).
The Critical Probabilistic Surface will (in general) have a HIGHER Reliability Index and a lower Probability of Failure than the Overall Slope results.
To view the Critical Probabilistic Surface:
- Select Statistics > Critical Probabilistic Surface > Show Critical Probabilistic Surface

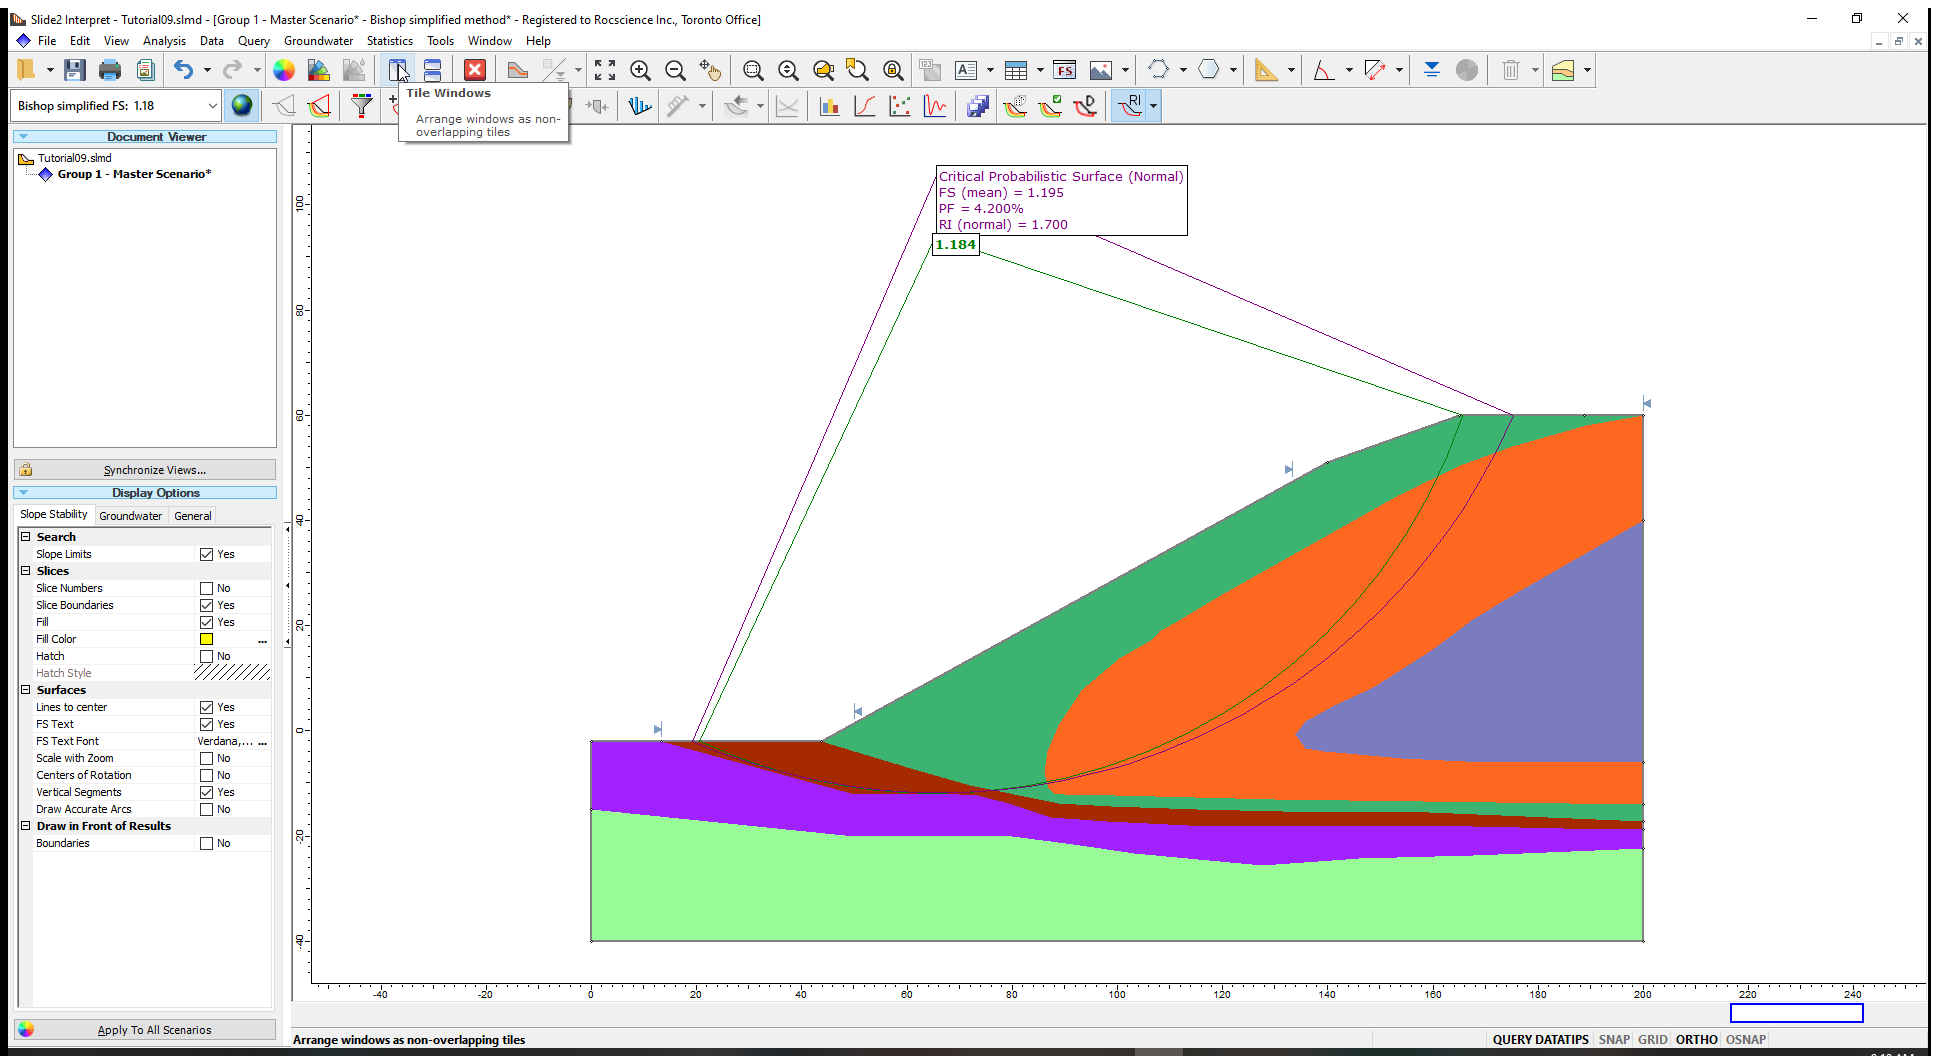
The Critical Probabilistic Surface (Normal) is displayed on the model with a corresponding PF and Reliability Index (RI (normal)).
It is possible to have two different Critical Probabilistic Surfaces located, depending on the assumption of a Normal or a Lognormal distribution of the Safety Factors.
To view the Lognormal distribution:
- Click on the drop-down arrow beside the Show Critical Probabilistic Surface icon in the toolbar.
- Select Assume Lognormal Distribution on the list displayed.
The Critical Probabilistic Surface results are now displayed assuming a lognormal distribution of the safety factors. In this case, the slip surface is the same for either assumption.
The results obtained from the Overall Slope Analysis is summarized in a table below.
Overall Slope |
FS (mean) |
PF (%) |
RI (normal) |
RI (lognormal) |
1.17 |
6.20 |
1.56 |
1.64 |
|
Critical Prob. Surface (Normal) |
1.20 |
5.30 |
1.65 |
- |
Critical Prob. Surface (Lognormal) |
1.20 |
5.30 |
- |
1.76 |
Critical Deterministic Surface |
1.19 |
5.20 |
1.66 |
1.76 |
The interpretation and application of these results for slope design purposes, is the responsibility of the geotechnical engineer. It is not possible to make a general statement regarding which Probability of Failure or Reliability Index should be used, as this may vary considerably depending on the model and the goals of the analysis.
- Turn off the Critical Probabilistic Surface.
4.3 Histogram Plots
Histogram Plots can be generated for Safety Factor data for the Overall Slope Probabilistic analysis.
Histograms can also be generated for any individual or a combination of Global Minimum Surface(s) generated after an Overall Slope Probabilistic analysis using the Pick GM Surfaces option.
The Pick GM Surfaces option is useful for determining which subsets of probabilistic input data (or safety factor) correspond to any individual surface (or any group of surfaces) displayed by the Show GM Surfaces option.
For example, let us determine which randomly generated Friction Angles (Phi) correspond to the two deep-seated Global Minimum surfaces.
To do this:
- Select Statistics > Pick GM Surfaces

The Show GM Surfaces option will automatically be toggled ON, if it was not already. - Zoom in to the slip surfaces and select the last two surfaces in the Upper Marine Sed. material. They will be highlighted by dashed lines.
- Right click on the model and select Histogram Plot
 from the popup menu to open the dialog.
 - In the Histogram Plot dialog, select Upper Marine Sed: Phi (deg) as the Data to Plot.
- Select the Highlight Data checkbox and choose Selected Surfaces
from the drop-down list. (The highlighted data on the plot, is the data corresponding to the two GM surfaces that we have selected.)
- Click on the Plot button to generate the desired plot.
If you accidentally select surfaces that you did not want to select, click on the surface(s) again with the left mouse button and the surface(s) will no longer be selected (highlighted).
We have plotted the randomly generated Friction Angles (Phi) of the dark red material (Upper Marine Sediment).
The highlighted data on the plot indicates that predominantly low Friction Angles of the Upper Marine Sediment material associated with the selected two slip surfaces which is consistent with the analysis results.
If desired, you can right-click on the plot and select the Highlighted Data Only option, to view ONLY the data for the selected surfaces. All other plotting options can also be used (for example, export the data to Excel, or the clipboard, for further processing in other applications.)
You can select Analysis > Report Generator  to see more detailed summaries of the analysis.
5.0 Response Surface
The Response Surface sampling method was added as an option in Slide2 to alleviate the significant computation time problem using the Overall Slope. This example has been set up to be fast to be of use as a tutorial. However, as has been mentioned, an Overall Slope analysis can take hours to compute.
The Response Surface method uses a small number of strategically selected computations to create a response surface of factor of safety (FS) values for various combinations of input parameters. It then predicts the factor of safety values for any combination of samples and provides an estimated probability of failure.
As an optional exercise:
- Add a new scenario, open the Project Settings and change the Sampling Method to Response Surfaces.
- Re-run the overall slope analysis.
You will notice that the Response Surface option will reduce the computation time by about 80%.
In conclusion, the Overall Slope probabilistic analysis option in Slide2 presents the user with a wide range of powerful analysis and data interpretation options, not previously available in slope stability software. You are encouraged to experiment with and explore these options.