6 - Excess Pore Pressure Tutorial
1.0 Introduction
This tutorial will demonstrate the Excess Pore Pressure (Undrained Loading) feature of Slide2, which allows you to account for short term changes in pore pressure due to rapidly applied loading conditions.
Finish Product:
The finished file can be found in File > Recent Folders > Tutorials Folder > Tutorial 6 Excess Pore Pressure.slmd.
The method used in Slide2 is the so-called “B-bar” method, in which the change in pore pressure (excess pore pressure) is assumed to be directly proportional to a change in vertical stress. The excess pore pressure is simply given by:

where B (B-bar) is the overall pore pressure coefficient for a material. The change in vertical stress can be due to the weight of added layers of material, vertical external loads, vertical seismic loads, or a combination of these factors.
For example, if an embankment is constructed over a clay foundation, this can create a temporary condition of “excess pore pressure” within the clay. Due to low permeability, the excess pore pressure within the clay cannot readily dissipate. A non-steady state situation then exists, in which the elevated pore pressure can lead to lower safety factors, and possible failure.
The calculation of the pore pressure with the Slide2 B-bar method may be thought of as a 2- stage analysis:
- Stage 1 - an initial pore pressure distribution is determined using any of the available methods in Slide2 (e.g. water surfaces, Ru coefficient, pressure grid, finite element analysis).
- Stage 2 - the excess pore pressure is then determined from the change in vertical stress and the B-bar coefficient for a material, according to Equation 1.
The final pore pressure which is used in the stability calculations is the sum of the Initial Pore Pressure + Excess Pore Pressure.
The following embankment model will demonstrate the Excess Pore Pressure (B-bar method) in Slide2. The tutorial consists of 4 steps:
STEP 1: First, the stability of the embankment will be determined for long-term (steady-state) conditions, without accounting for undrained loading.
STEP 2: Next, we will assume undrained loading conditions. The embankment material will be specified as “causing excess pore pressure”, and the clay foundation layers will be assigned B-bar pore pressure coefficients.
STEP 3: Next, we will add an additional load on the embankment. The load will also be specified as “causing excess pore pressure”.
STEP 4: Finally, we will demonstrate that the embankment material can also be assigned an initial pore pressure distribution, even though it is assumed to be added in “stage 2”.
2.0 Step 1 - No Excess Pore Pressure
- From the Slide2 main menu, select File > Recent Folders > Tutorials Folder and read in the Tutorial 6 Embankment1.slmd file.
- Run Compute
 View the results in Interpret
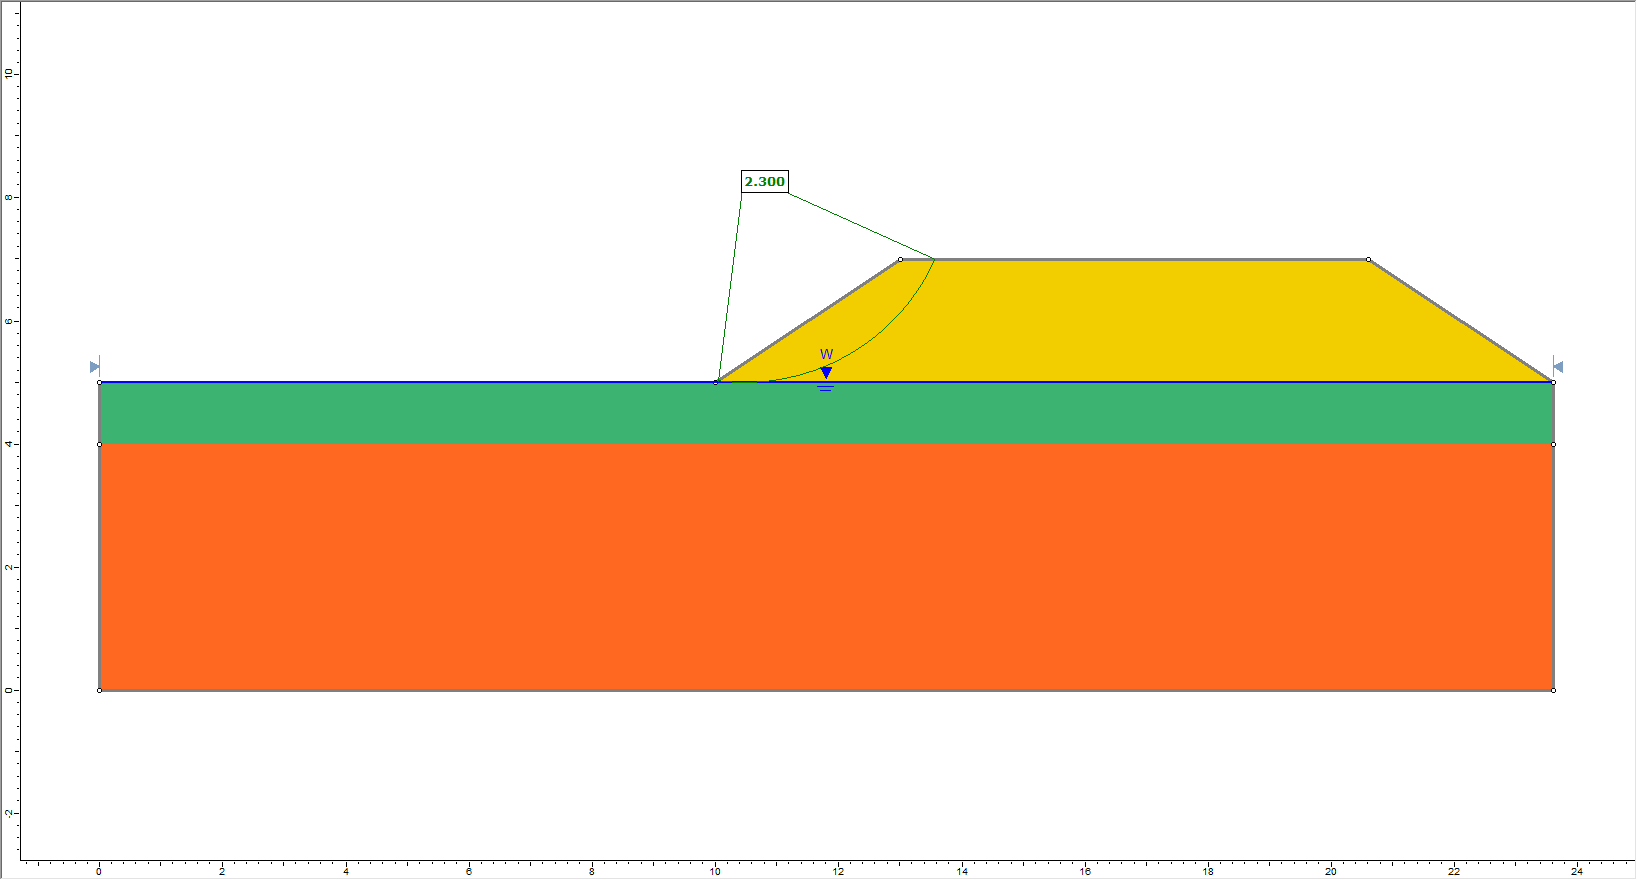
You will see that the minimum safety factor slip surface (FS = 2.30), passes only through the embankment material, and does not extend into the supporting clay layers.
3.0 Step 2 -Excess Pore Pressure (Embankment Weight)
- Go back to the Modeller.
- Duplicate the Group by right-clicking "Group 1 - Master Scenario" and selecting Duplicate.
We will now be working with “Group 2 – Master Scenario”.
3.1 PROJECT SETTINGS
- Open the Project Settings
 dialog and select the Groundwater tab.
 - Tick the Advanced checkbox and then select the Excess Pore Pressure option. This option must be selected in order to compute excess pore pressure using the B-bar method.
- Click Ok to close the dialog.
3.2 MATERIAL PROPERTIES
- Select Properties > Define Materials

- For the first material (“embankment”), select the Material weight creates excess pore pressure checkbox. This means that, for the purpose of the excess pore pressure calculation, the weight of the “embankment” material will create excess pore pressure in any material underneath the embankment which has a B-bar > 0 coefficient specified. The excess pore pressure will be calculated according to Equation 1.
- Select the second material (“upper clay”). Specify B-bar = 1.
- Select the third material (“lower clay”). Specify B-bar = 1.
- Click OK to save the changes.
- Now run Compute , and view the results in Interpret
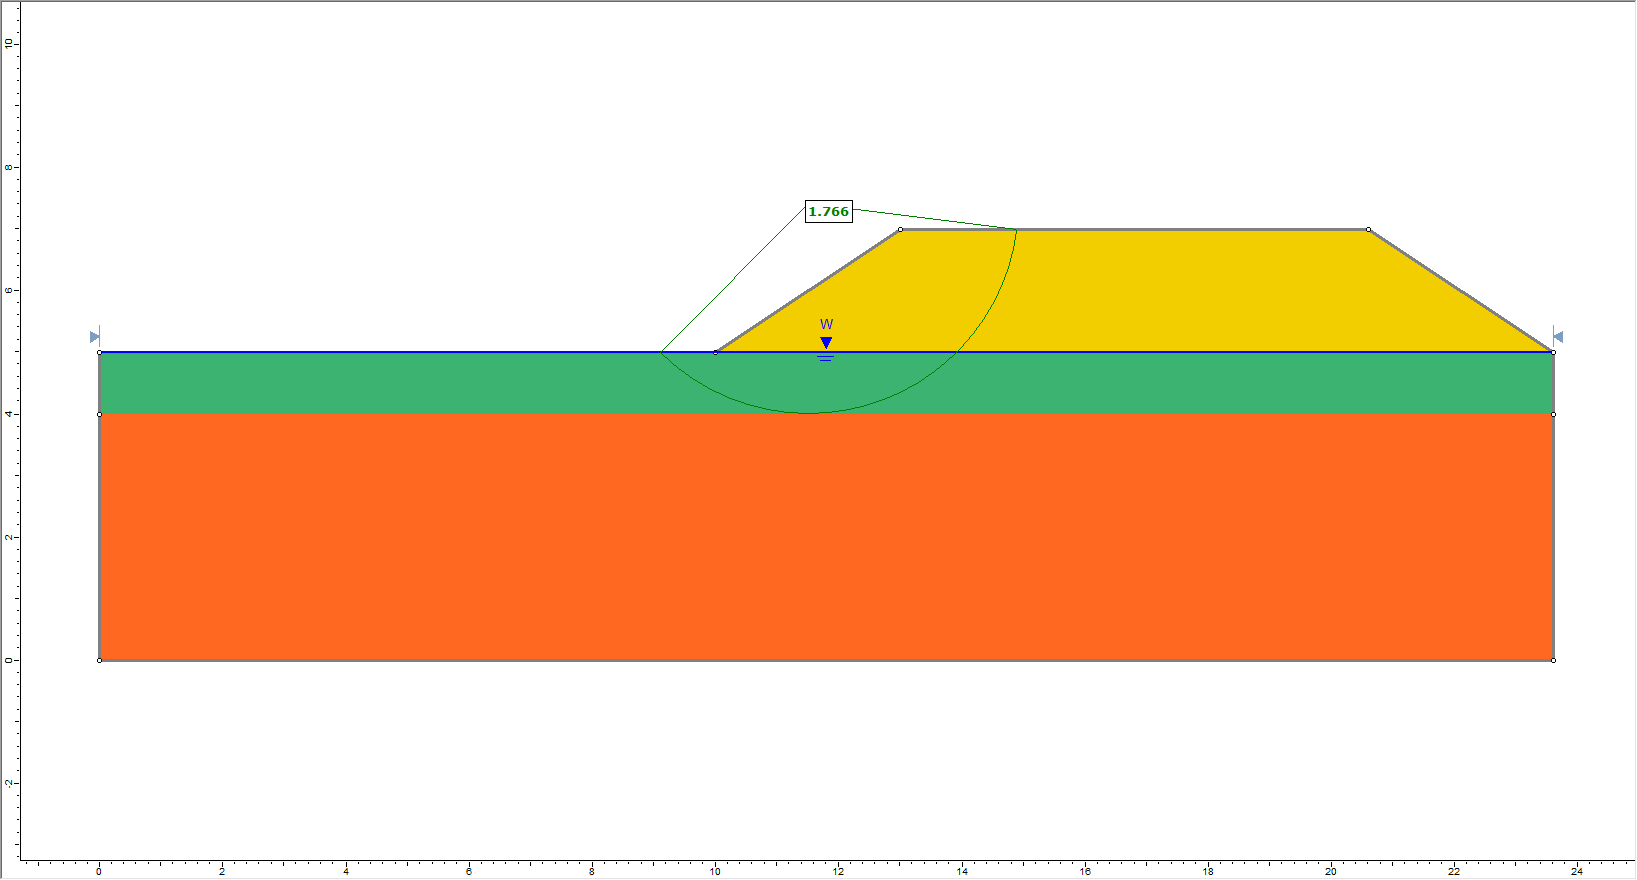
You should see the following critical slip surface (FS = 1.77). As you can see, the critical slip surface now extends into the upper clay layer.
- Right-click on the critical slip surface and select Add Query and Graph

- In the dialog, select Pore Pressure as the primary data, and Initial Pore Pressure as the secondary data.
- Click Create Plot , and you should see the following plot.
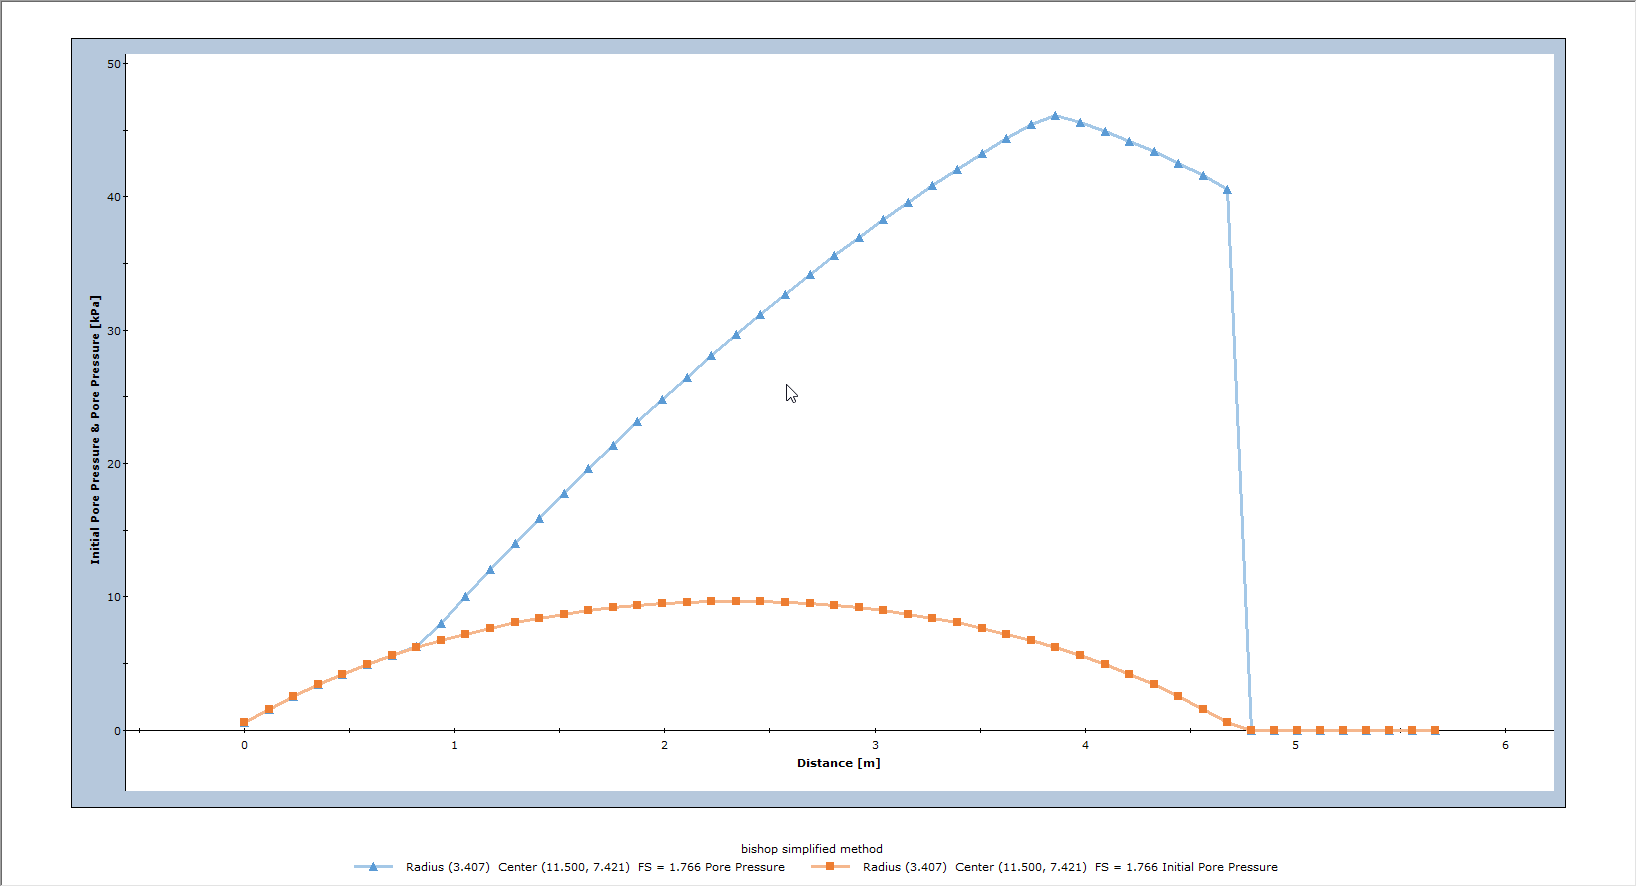
The Initial Pore Pressure is due to the water table located at the original ground surface. The (final) Pore Pressure is the sum of the Initial Pore Pressure, and the Excess Pore Pressure created by the weight of the embankment. As you can see from this example, the Excess Pore Pressure is quite significant and greater than the Initial Pore Pressure.
You can plot Excess Pore Pressure by doing the following:
- Right-click on the graph and select Change Plot Data.
- Select Excess Pore Pressure as the secondary data.
- Click Create Plot and you should see the following plot.
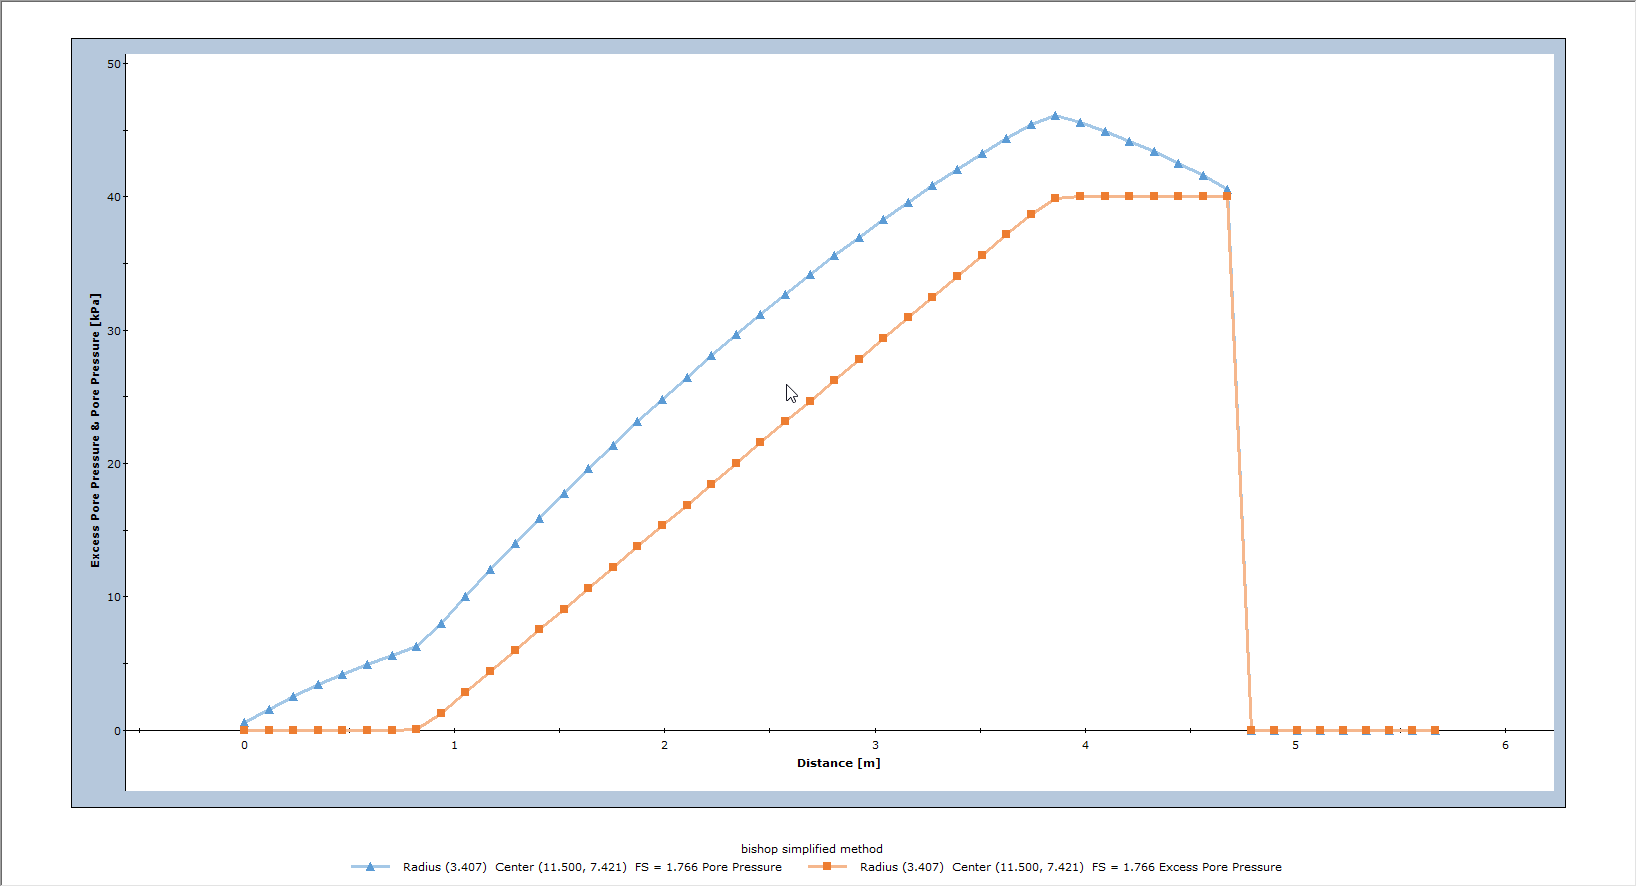
The Excess Pore Pressure curve displays only the excess pore pressure calculated along the slip surface, due to the weight of the embankment acting on the upper clay layer.
4.0 Step 3 – Excess Pore Pressure (Embankment Weight and Distributed Load)
In Slide2, material weight is not the only mechanism which can cause undrained loading. External loads can also be specified as “causing excess pore pressure”. To demonstrate this, we’ll create another scenario in the second group.
- Return to the Modeller.
- Right-click Group 2 - Master Scenario and select Add Scenario

- Right-click the new scenario and select Rename. Name the scenario “Distributed Load”.
We will now add a distributed load to the top of the embankment.
- Select Loading > Add Distributed Load
- Specify Orientation = Vertical.
- Enter Magnitude = 10 kPa.
- Check the Load that creates an excess pore pressure checkbox.
- Click Ok to close the dialog.
- Define the load between coordinates (13,7) and (20.6,7).
For the purpose of the excess pore pressure calculation, the load (vertical component only) will create excess pore pressure in any material underneath the load which has a B-bar > 0 coefficient specified. The excess pore pressure will be calculated according to Equation 1.
- Now run Compute , and view the results in Interpret .
You should see the following critical slip surface (FS = 1.47).
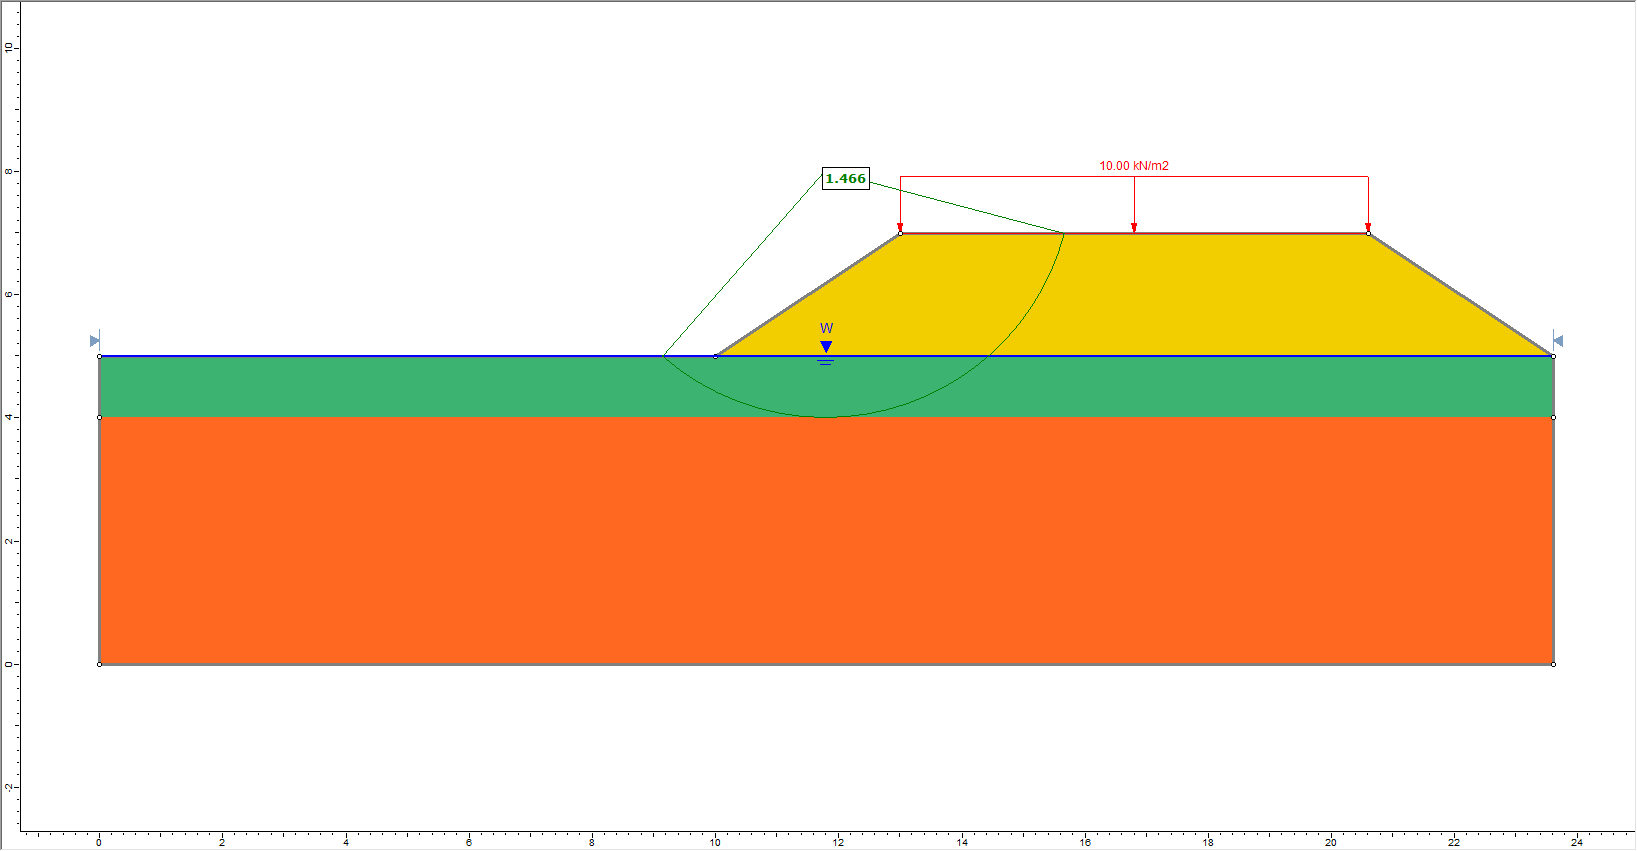
A different critical slip surface has been determined, with an even lower safety factor.
- Right-click on the critical slip surface and select Add Query and Graph
- In the dialog, select Pore Pressure as the primary data, and Initial Pore Pressure as the secondary data.
- Click Create Plot , and you should see the following plot.
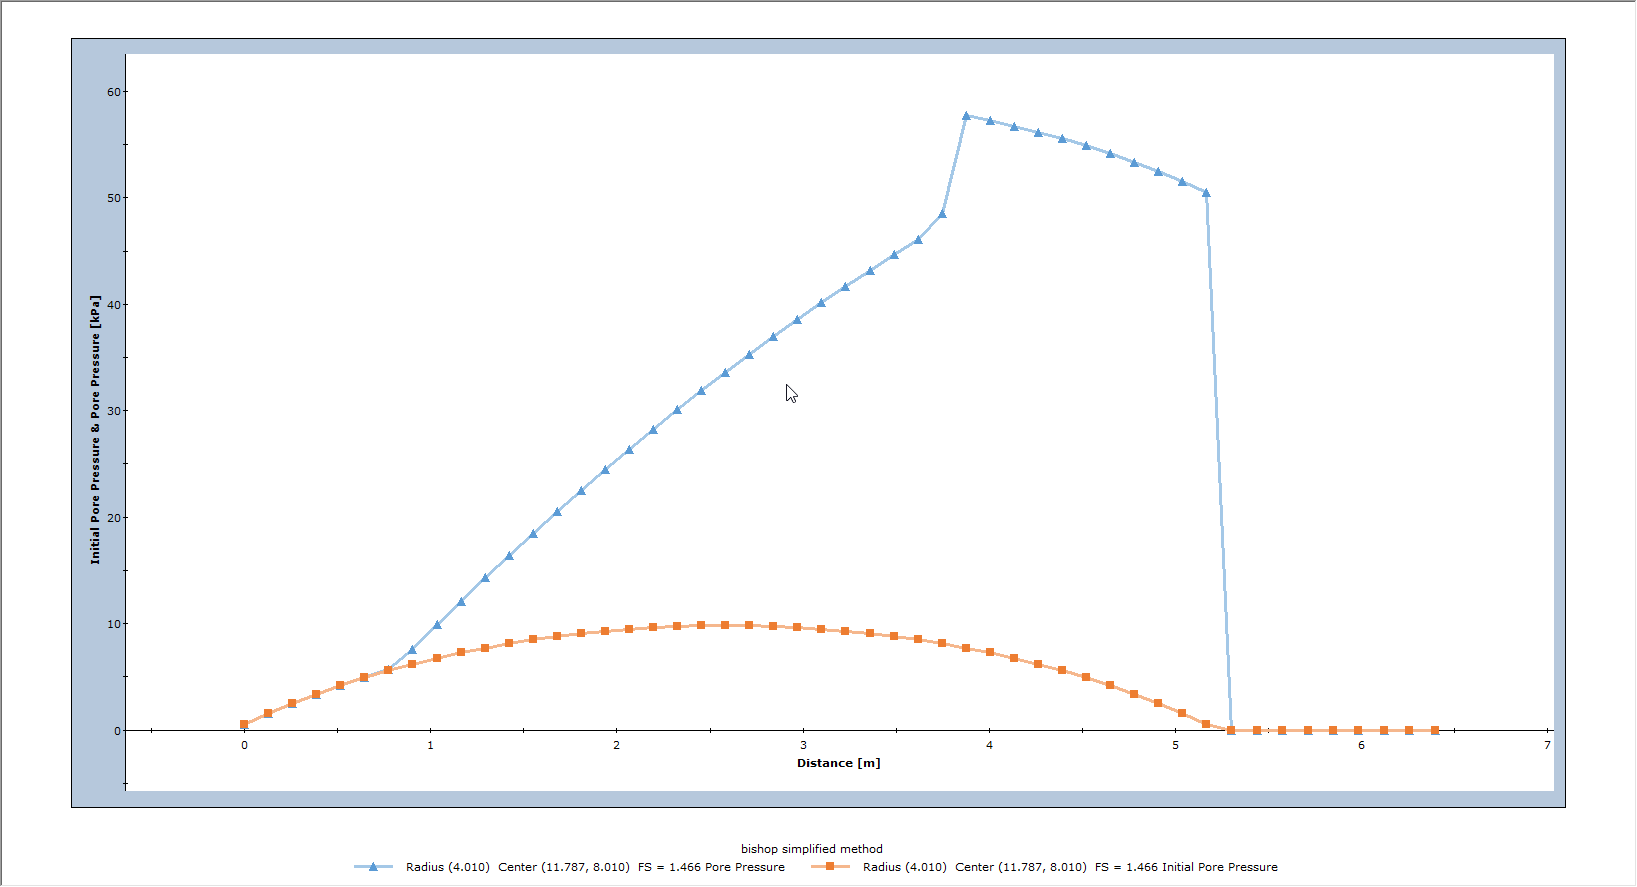
The (final) Pore Pressure is the sum of the Initial Pore Pressure and the Excess Pore Pressure. The Excess Pore pressure is now due to the change in vertical stress created by both the embankment weight AND the distributed load.
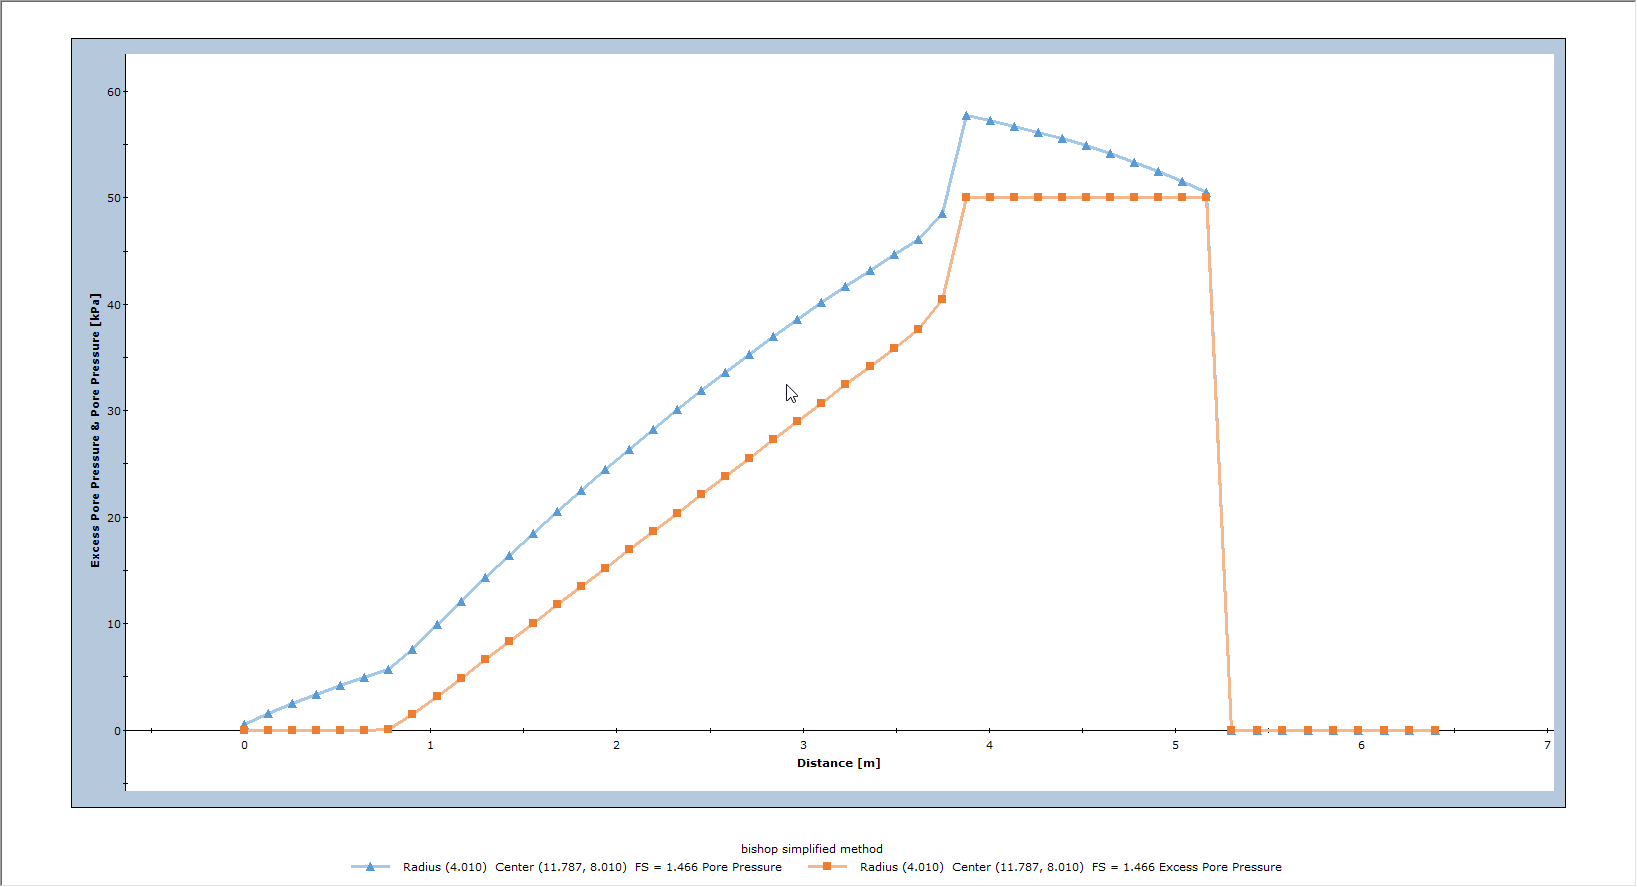
- Right-click on the graph and select Change Plot Data

- Select Excess Pore Pressure as the secondary data.
- Click Create Plot
5.0 Step 4 – include initial pore pressure within embankment
In this tutorial, we have so far not considered any pore pressure within the embankment material (pore pressure = 0). The embankment material can also have an initial pore pressure distribution.
- Duplicate the Distributed Load scenario and rename it "Embankment Pressure." We will be editing this scenario.
Now we will create another embankment material, duplicating the original, since we want to modify some of the water-related material properties.
- Right-click on the embankment material and select Material Properties.
- Click on the Copy Material Properties
 icon, then select Material 4 from the Copy Material Properties dialog.
 - Go to Material 4 and rename it “embankment modified.”
- Specify an Ru = 0.4 for this material.
- Click OK to close the dialog.
- Right-click on the embankment and change the material assignment to embankment modified.
- Run Compute , and view the results in Interpret .
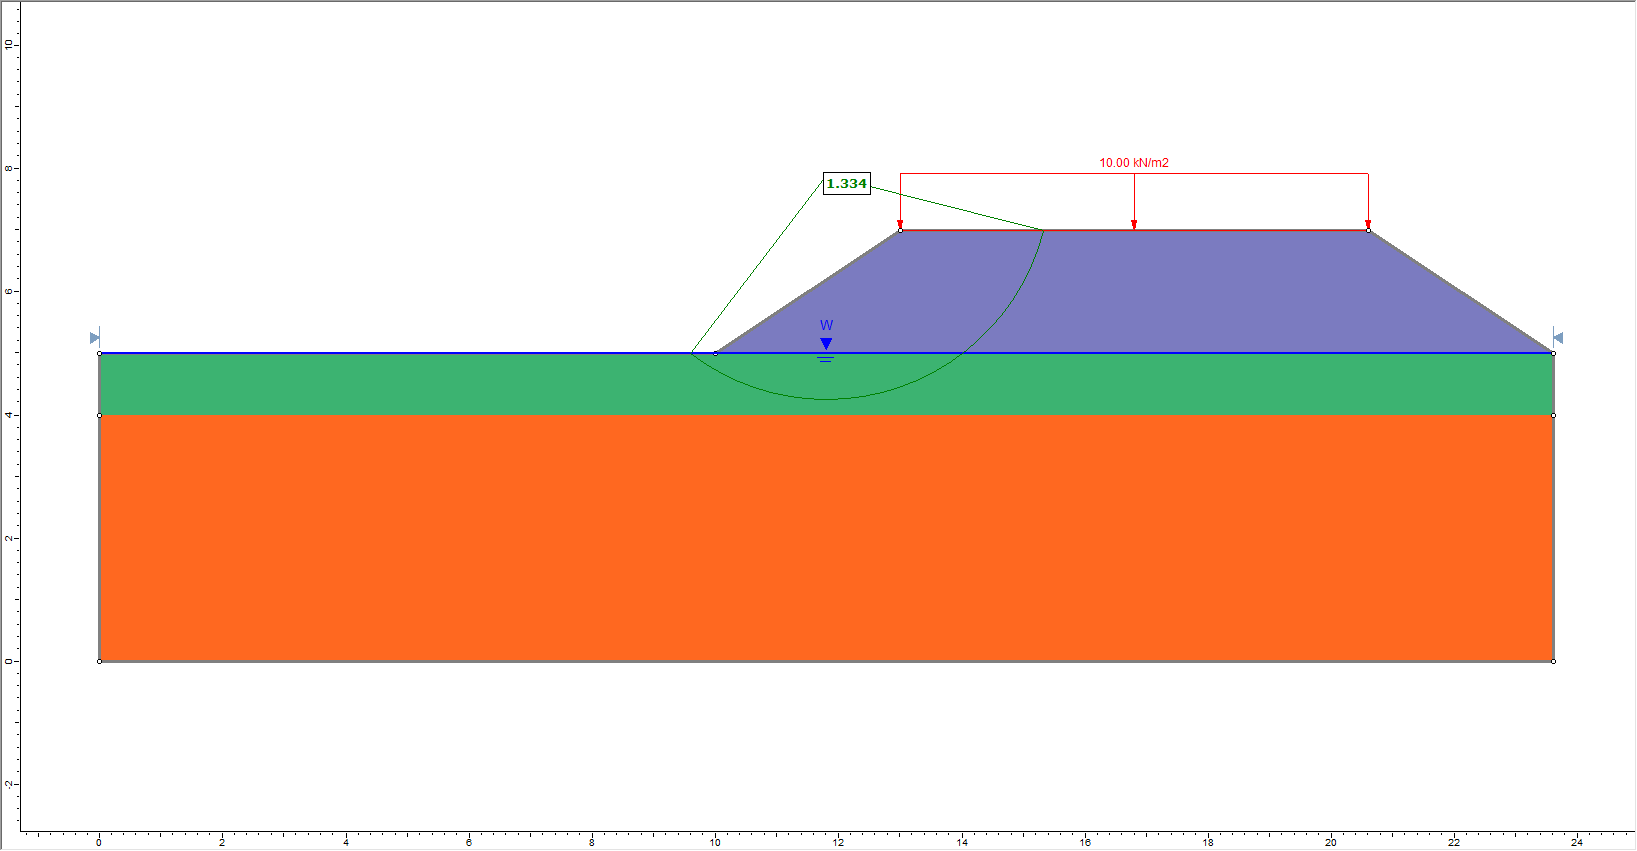
You should see the following critical slip surface (FS = 1.33). The safety factor is now lower than the Distributed Load scenario, because pore pressure is now calculated for the embankment material, as well as the clay layers.
- Right-click on the critical slip surface and select Add Query and Graph
- In the dialog, select Pore Pressure as the primary data, and Initial Pore Pressure as the secondary data.
- Click Create Plot
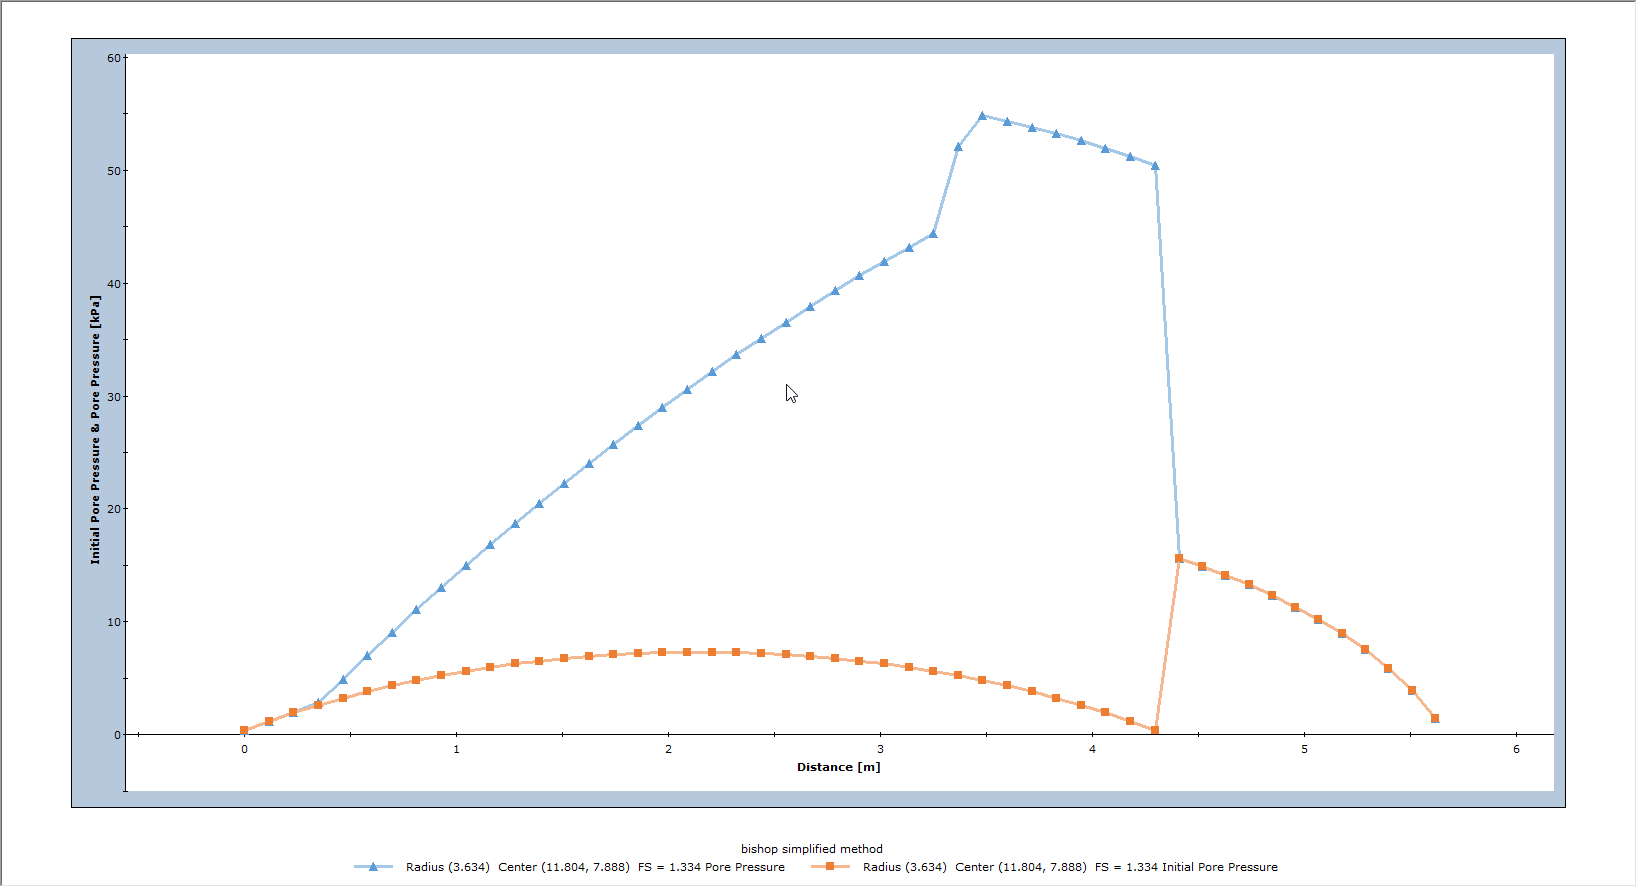
Notice that the pore pressure is no longer zero for the portion of the slip surface within the embankment material (right-hand side of the curves in the above figure).
- Right-click on the graph and select Change Plot Data
- Select Excess Pore Pressure as the secondary data.
- Click Create Plot
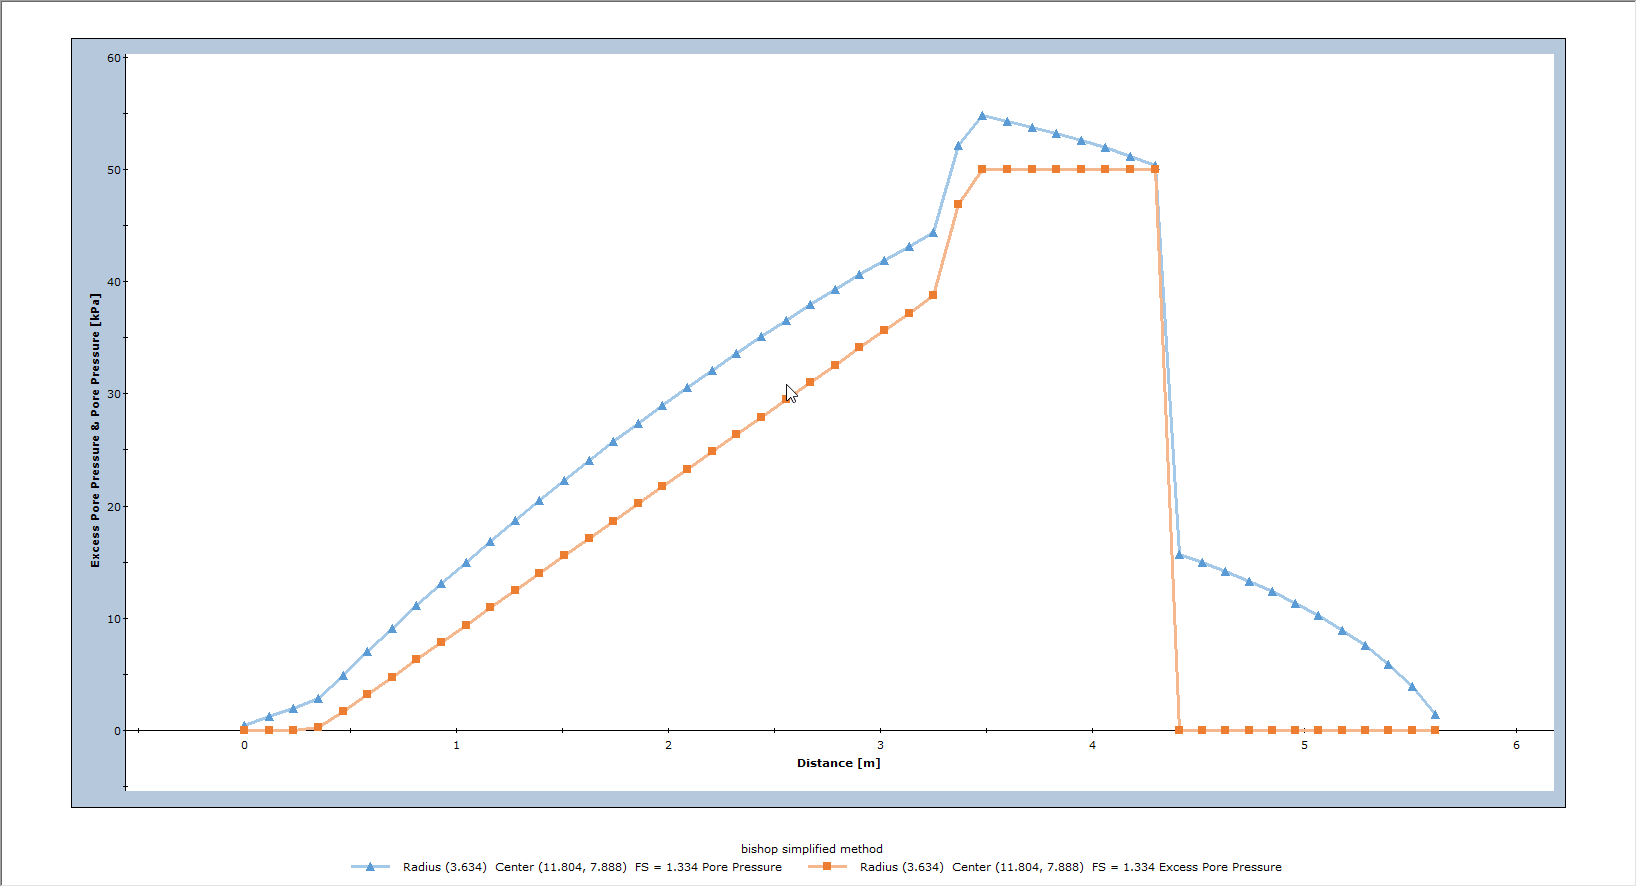
Notice in the above plot that the Excess Pore Pressure within the embankment is ZERO. Although the embankment weight creates excess pore pressure within the clay layers beneath, the embankment weight does not create excess pore pressure within itself because B-bar = 0 for the embankment material.
6.0 Additional Exercises
- Re-run this example using ONLY the distributed load to create excess pore pressure, and NOT the material weight. Hint: simply turn OFF the checkbox for “Material weight creates excess pore pressure”, for the embankment material, in the Define Material Properties dialog. Graph the Final and Excess Pore pressure for the critical slip surface.
- In this tutorial we have demonstrated that Excess Pore Pressure (Undrained Loading) can be generated by material weight and/or distributed loading. In Slide2, Excess Pore Pressure can also be generated by Seismic Loading (vertical coefficient only), or Line Loads (vertical component only). Just select the “Load creates excess pore pressure” checkbox in the Seismic Load dialog or the Line Load dialog, when you define Seismic or Line loads.