Probabilistic Analysis
In Slide2, you can perform a Probabilistic slope stability analysis to determine the effect of uncertainty or variability of input parameters, on the results of the slope stability analysis.
For an overview of the Probabilistic Analysis procedure in Slide2, see the Probabilistic Analysis Overview topic.
The Probabilistic Analysis options in the Project Settings dialog, are described below.
Probabilistic Analysis
To enable a Probabilistic Analysis with Slide2, the first thing you must do is select the Probabilistic Analysis checkbox on the Statistics page of the Project Settings dialog. When you select the Probabilistic Analysis checkbox:
- The Probabilistic Analysis options will be enabled in the Project Settings dialog (see below).
- A Statistics menu will be available in the Slide2 main menu. The Statistics menu contains all of the options which allow you to define the input data random variables for your probabilistic analysis (e.g. material properties, support properties, loading properties etc).
SAMPLING METHOD
The Sampling Method determines how the statistical input distributions for the random variables you have defined for a Probabilistic Analysis, will be sampled. Two Sampling Methods are available in Slide2 – Monte Carlo or Latin Hypercube sampling.
MONTE CARLO METHOD
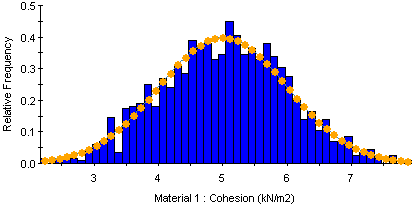
The Monte Carlo sampling technique uses random numbers to sample from the input data probability distributions. Monte Carlo techniques are commonly applied to a wide variety of problems involving random behaviour, in geotechnical engineering.

LATIN HYPERCUBE METHOD
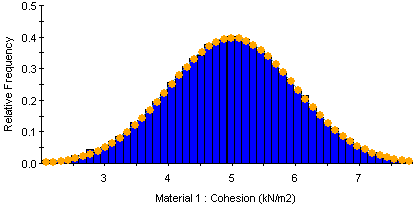
The Latin Hypercube sampling technique gives comparable results to the Monte Carlo technique, but with fewer samples. The method is based upon "stratified" sampling with random selection within each stratum. This results in a smoother sampling of the probability distributions. Typically, an analysis using 1000 samples obtained by the Latin Hypercube technique will produce comparable results to an analysis of 5000 samples using the Monte Carlo method.

RESPONSE SURFACE
The Response Surface sampling method uses a small number of strategically selected computations to create a response surface of factor of safety (FS) values for various combinations of input parameters. It then predicts the factor of safety values for any combination of samples and provides an estimated probability of failure. Since an Overall Slope probabilistic analysis can take extensive hours in 2D, this method is advantageous in significantly cutting down computation time.
For more information on how response surface works, see Using Response Surface.
Number of Samples
The Number of Samples which will be generated for each random variable, for the Probabilistic Analysis. For example, if Number of Samples = 1000, then 1000 values of each random variable (for example, Cohesion of Material 1) will be generated, according to the Sampling Method and statistical distribution for each random variable. The analysis will then be run 1000 times, and a safety factor calculated for each sample. This results in a distribution of safety factors, from which the Probability of Failure is calculated.
TIP: How many samples are "enough"? You can get a good idea of how many samples is appropriate for your analysis, by viewing a Samples Convergence Plot in the Slide2 Interpret program (select Statistics > Convergence Plot in the Slide2 Interpret program). This plot will indicate the minimum number of samples which is necessary to converge to a final answer (i.e. mean safety factor, probability of failure).
Spatial Variability Analysis
This option allows you to define the spatial variability of material properties. See the Spatial Variability topic.
Probabilistic Analysis Type
There are two different methods of performing a Probabilistic Analysis with Slide2:
- the Global Minimum method
- the Overall Slope method.
These are described below.
GLOBAL MINIMUM METHOD
The Global Minimum Probabilistic Analysis Type in Slide2 is commonly used in slope stability analysis. With this method:
- The regular (DETERMINISTIC) slope stability analysis is first carried out, in order to determine the slip surface with the overall (Global Minimum) factor of safety, of all the slip surfaces analyzed.
- The probabilistic analysis is then carried out on the Global Minimum slip surface, using the samples generated for each random variable. This means that the slope stability calculation is repeated N times (where N = Number of Samples) for the Global Minimum Slip surface. This results in N calculated safety factors. The Probability of Failure is then simply the number of analyses which result in a safety factor less than 1, divided by the total Number of Samples.
The Global Minimum Probabilistic Analysis Type assumes that the Probability of Failure calculated for the (Deterministic) Global Minimum slip surface, is representative of the Probability of Failure for the entire slope. In many cases, this may be a valid or reasonable assumption. An alternative method which does not rely on this assumption (the Overall Slope Method) is described below.
OVERALL SLOPE METHOD
The Overall Slope Probabilistic Analysis Type in Slide2 represents a different approach to the probabilistic analysis of slope stability.
- With the Overall Slope method in Slide2, the ENTIRE SEARCH for a Global Minimum slip surface is repeated N times (where N = Number of Samples). For each search iteration, a new set of random variable samples is first loaded, and the search is carried out.
- A Global Minimum slip surface, FOR EACH SEARCH iteration, is then determined. This will generally result in the location of SEVERAL different Global Minimum slip surfaces, corresponding to different values of the sampled input data random variables.
- A typical Overall Slope probabilistic analysis, might result in the location of 10 to 50 different Global Minimum slip surfaces. However, the actual number will depend on your model, search method, and the distributions of your random variables.
- The definition of the Probability of Failure, for the Overall Slope method, is the same as for the Global Minimum method. That is, the Probability of Failure is the number of analyses which result in a safety factor less than 1, divided by the total Number of Samples.
The advantage of the Overall Slope method, compared to the Global Minimum method, is that the Overall Slope method does NOT assume that the Probability of Failure for the slope, is equal to the Probability of Failure of the Deterministic Global Minimum slip surface.
Instead, the ENTIRE SEARCH is repeated, using different values (samples) of the input data random variables, for each search iteration. This is perhaps a more rational approach to probabilistic slope stability analysis since it does not assume a fixed location of the Global Minimum slip surface. This approach would not have been feasible only a few years ago, due to the extensive computation time which would have been involved. With the current speed of the latest personal computers, such an analysis is now practical.
However, it must be pointed out, that the Overall Slope method will involve a substantially greater computation time, than the Global Minimum method. Depending on the Number of Samples, and the complexity of your model, the Overall Slope Probabilistic Analysis in Slide2, may take SEVERAL HOURS to complete. In general, you may wish to run an Overall Slope probabilistic analysis, at the end of a day, as an overnight run. Remember that the Slide2 Compute Engine can run multiple files in succession, so you can set up several files for an Overall Slope Probabilistic Analysis, and run the analyses overnight.
If you have selected multiple analysis methods (e.g. Bishop, Janbu etc) the Overall Slope Probabilistic Analysis is carried out independently for each Analysis Method.
Critical Probabilistic Slip Surface
In addition to the Overall Slope reliability, the Critical Probabilistic Slip Surface is also calculated, when the Probabilistic Analysis Type = Overall Slope. The Critical Probabilistic Surface is the individual slip surface which has the maximum Probability of Failure (and also the Minimum Reliability Index). This slip surface WILL NOT NECESSARILY BE THE SAME AS THE CRITICAL DETERMINISTIC SLIP SURFACE. See the Critical Probabilistic Surface topic for more information.