13 - Multiple Boreholes
1.0 Introduction
This tutorial provides instructions on how to model multiple boreholes with non-horizontal soil strata in Settle3. Before proceeding with the tutorial, make sure you’ve gone through Tutorial 01 – Settle3 Quick Start so you’re familiar with the product’s basic functions and features.
Topics Covered in this Tutorial:
- Multiple boreholes
- Multiple water level input
- Display options
Finished Product:
The finished product of this tutorial can be found in the Tutorial 13 Multiple Boreholes.s3z file. All tutorial files installed with Settle3 can be accessed by selecting File > Recent Folders > Tutorials Folder from the Settle3 main menu.
2.0 Model
2.1 Project Settings
-
Select Home > Project Settings
 (CTRL + J) to open the Project Settings dialog.
-
In the General tab, make sure the Units are set as:
- Stress: Metric, stress as kPa
- Settlement: Millimeters
- Click on the Soil Profiles tab. Notice that you can model either Horizontal Soil Layers or Non-Horizontal Soil Layers. In this tutorial, we will model non-horizontal soil strata with multiple boreholes.
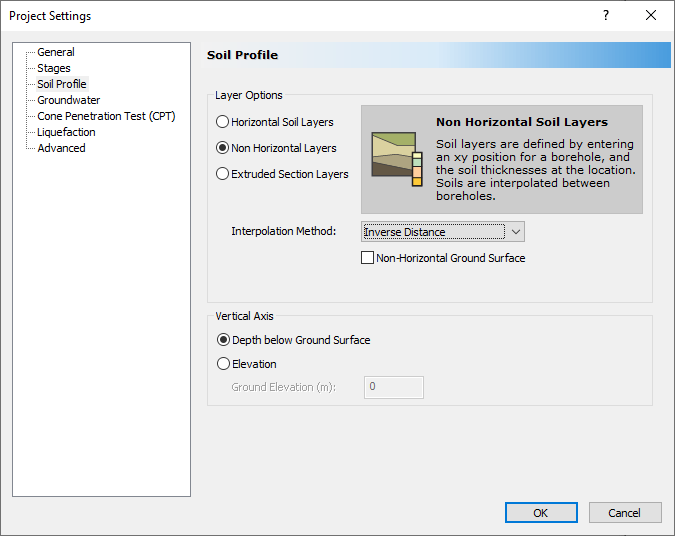
- Select the Non-Horizontal Layers option.
- Select 'Depth below Ground Surface' option in Vertical Axis
- There are five interpolation options available. For this tutorial, we will use the Inverse Distance method.
-
Click on the Groundwater tab. Check the Groundwater Analysis checkbox and change the Method to Grid.
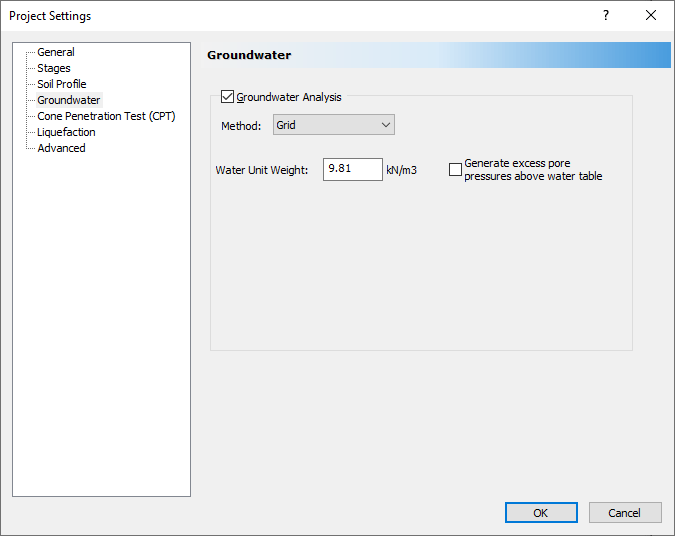
- Click OK to close the dialog.
2.2 Soil Properties
-
Select Soils > Define Soil Properties
 icon in the toolbar.
- For Soil Property 1, select the Immediate Settlement tab and check the box for Immediate Settlement.
- Enter the below data:
# |
Name |
Unit Weight (kN/m3) |
Sat. Unit Weight (kN/m3) |
Es (kPa) |
Esur (kPa) |
1 |
Sand Fill |
18 |
18 |
25000 |
25000 |
- Select the Primary Consolidation tab and set the Material Type as Linear.
- Enter the following values:
mv (m2/kN) |
mvur (m2/kN) |
0.0002 |
0.0002 |
- Repeat the above steps for the next two soil layers and enter the data below.
# |
Name |
Unit Weight (kN/m3) |
Sat. Unit Weight (kN/m3) |
Es (kPa) |
Esur (kPa) |
mv (m2/kN) |
mvur (m2/kN) |
1 |
Sand Fill |
18 |
18 |
25000 |
25000 |
0.0002 |
0.0002 |
2 |
Silty Sand |
18 |
18 |
20000 |
20000 |
0.0002 |
0.0002 |
3 |
Dense Silty Sand |
19 |
19 |
25000 |
25000 |
0.0002 |
0.0002 |
-
For Soil Property 4, leave the Immediate Settlement box unchecked.
-
Go to the Primary Consolidation tab and set the Material Type as Non-Linear.
- Enter the following values:
# |
Name |
Unit Weight (kN/m3) |
Sat. Unit Weight (kN/m3) |
Es (kPa) |
Esur (kPa) |
Cc |
Cr |
e0 |
OCR |
4 |
Silty Clay |
18 |
18 |
- |
- |
0.38 |
0.01 |
1.1 |
0.7 |
- Click OK to close the dialog.
3.0 Adding Boreholes
-
Select Soils > Add Multiple (Boreholes)

- Specify the Number of Boreholes To Add. For this tutorial, we will enter 4.
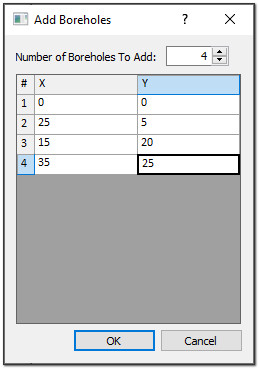
- Enter the coordinates of the Boreholes from the chart below and click OK.
Borehole Name |
Location |
|
X |
Y |
|
BH1 |
0 |
0 |
BH2 |
25 |
5 |
BH3 |
15 |
20 |
BH4 |
35 |
25 |
- The Edit Borehole dialog will appear. Click on Insert Layer Below three times. The layers will fill in with the correct names automatically.
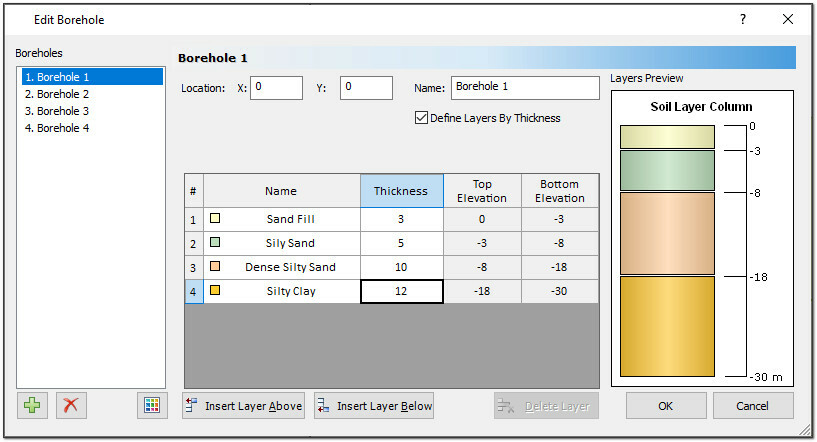
- For each Borehole, specify the Thickness of each layer using the values below:
Material |
BH1 |
BH2 |
BH3 |
BH4 |
Sand Fill |
3 |
5 |
4 |
4 |
Silty Sand |
5 |
6 |
7 |
8 |
Dense Silty Sand |
10 |
12 |
8 |
10 |
Silty Clay |
12 |
7 |
11 |
8 |
- Click OK to close the dialog. You should be able to see boreholes in the 2D Planview. It will not show 3D view until the load is added.
Use your mouse to rotate the model to get a closer look at the soil strata.
4.0 Loads and Field Grid
-
Select Loads > Circular Load

- Keep the default settings and click OK. In the bottom right of the screen, specify the load location as x,y = 20,15.
-
Select Query > Add Fieldpoint Grid (CTRL + G)

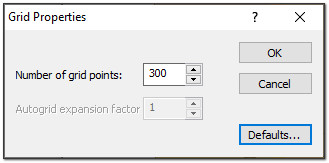
- Keep the default settings and click OK.
- In the bottom right of the screen, specify the first point as x,y = -5,-5 m, and the second point as x,y = 40,30 m.
5.0 Groundwater Data
-
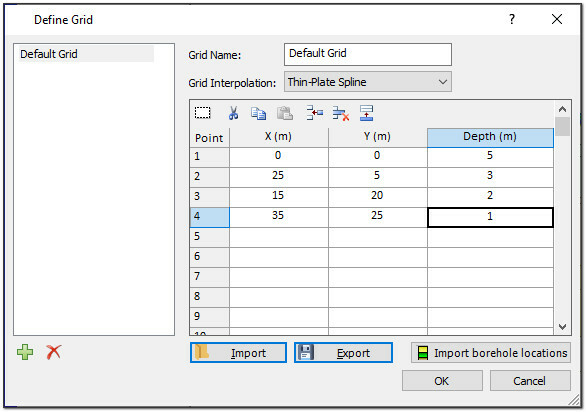
Select Groundwater > Edit (Pressure Grids)

- In the dialog box that appears, check the Use borehole locations as XY-coordinates checkbox. We are going to specify the water depth at each borehole location.
- Enter the below depth data:
- Click OK to close the dialog.
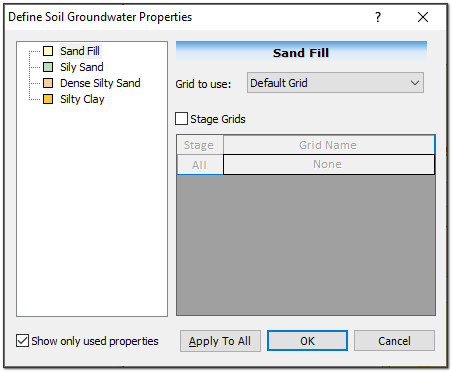
- Select Groundwater > Soil Groundwater Properties.
- Check the Show only used properties checkbox.
- Click on Sand Fill, then select Default Grid from the Grid to use the dropdown. Then click on Apply To All.
- Click OK to close the dialog.
| X (m) | Y (m) | Depth (m) |
| 0 | 0 | 5 |
| 25 | 5 | 3 |
| 15 | 20 | 2 |
| 35 | 25 | 1 |
You can now use the View Controls to view the Water Surface.
You can turn the water surface on and off by checking and unchecking the Water Surface checkbox. Uncheck the Field Point Grid option to turn the grid off and view the water surface more clearly.
6.0 Display Options
We’ll now take a look at the different viewing options associated with using multiple boreholes.
- In the View Controls, uncheck the Groundwater Grid and Water Surface checkboxes to turn them off.
- In the Depth/Soil Layers section of the left-side controls, enter Location X: 5 Y: 5.
Notice the change in the soil column below. The soil column changes will the input x-y location and is determined by interpolating between the boreholes.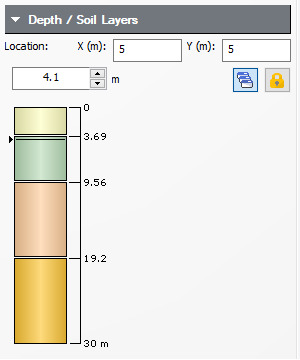
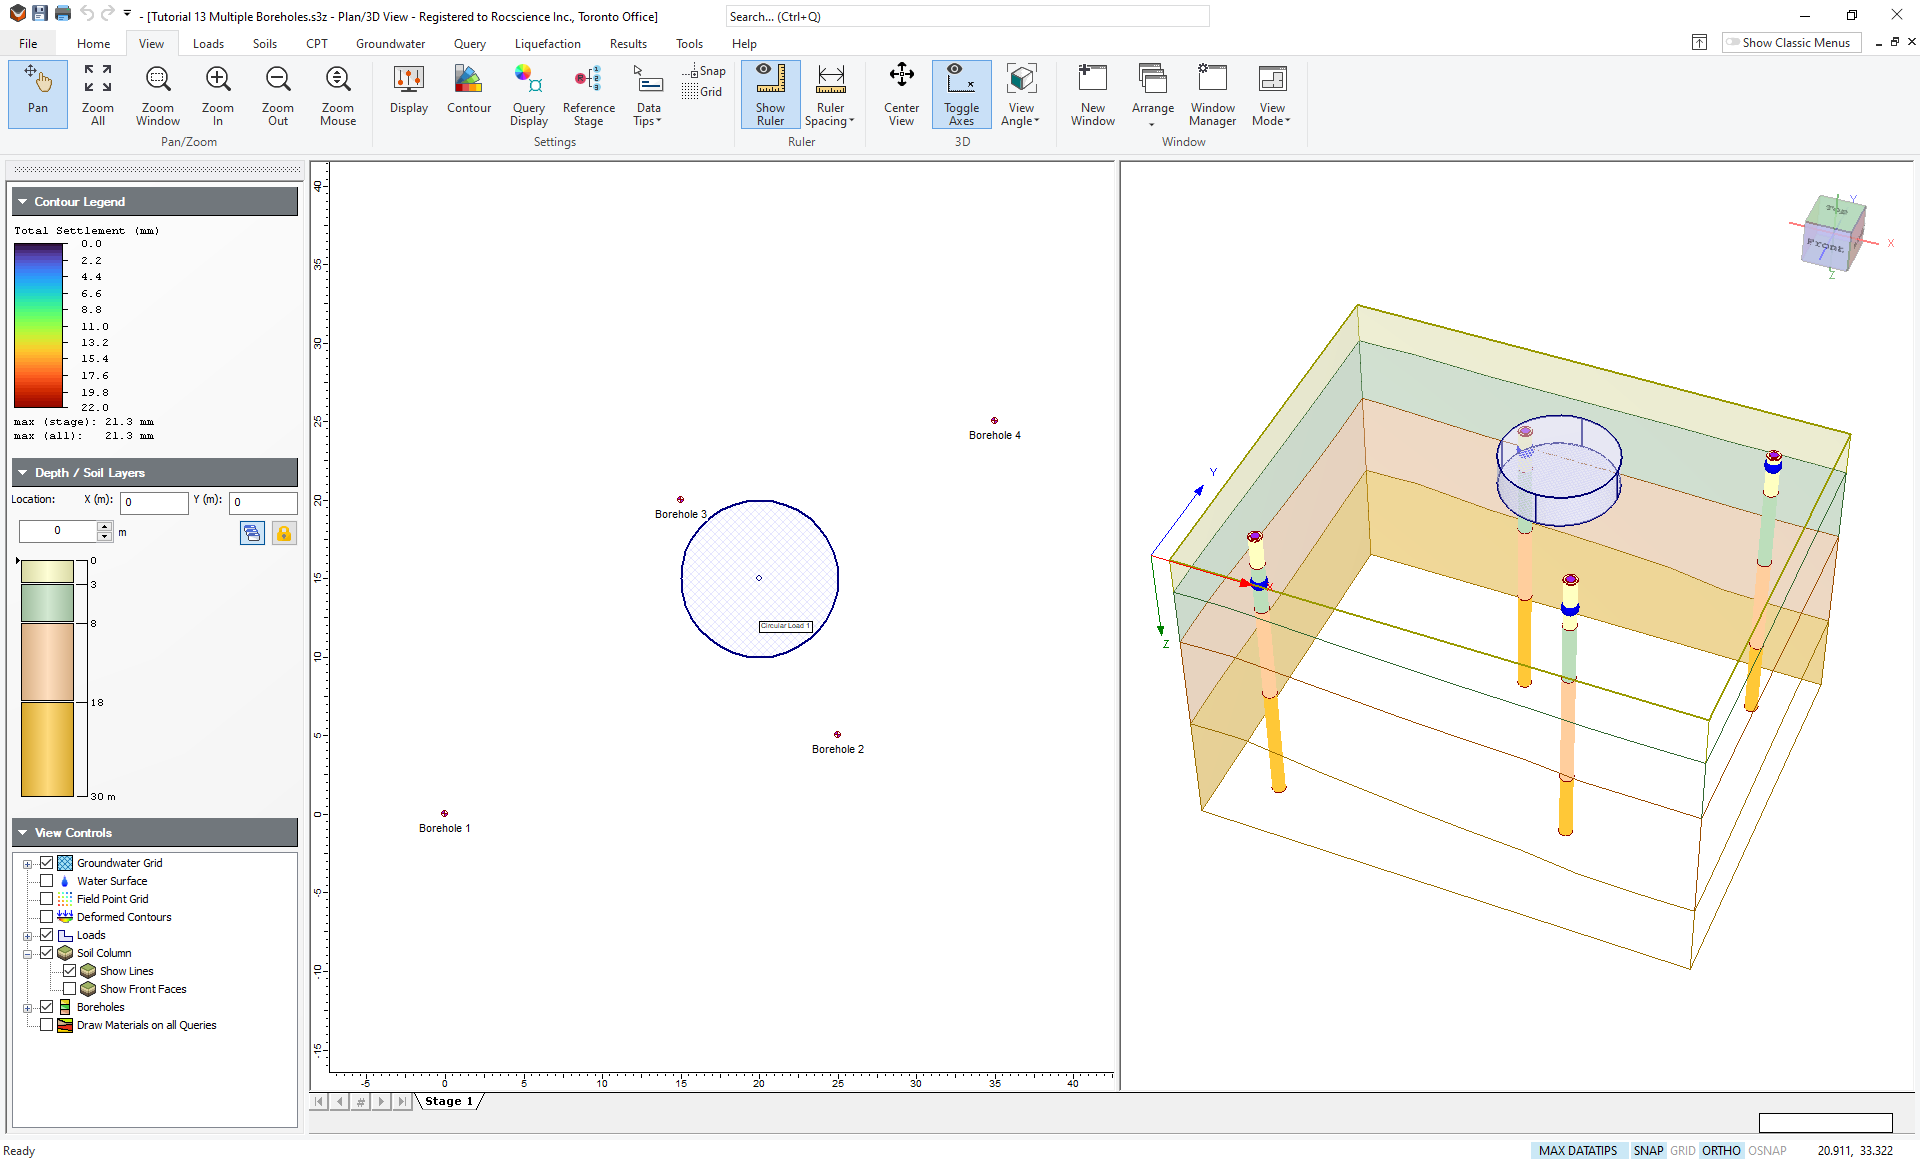
- Click on Field Point Grid in the View Controls to turn the grid back on, and click on the Draw Materials on all Queries checkbox. You will see the figure below:
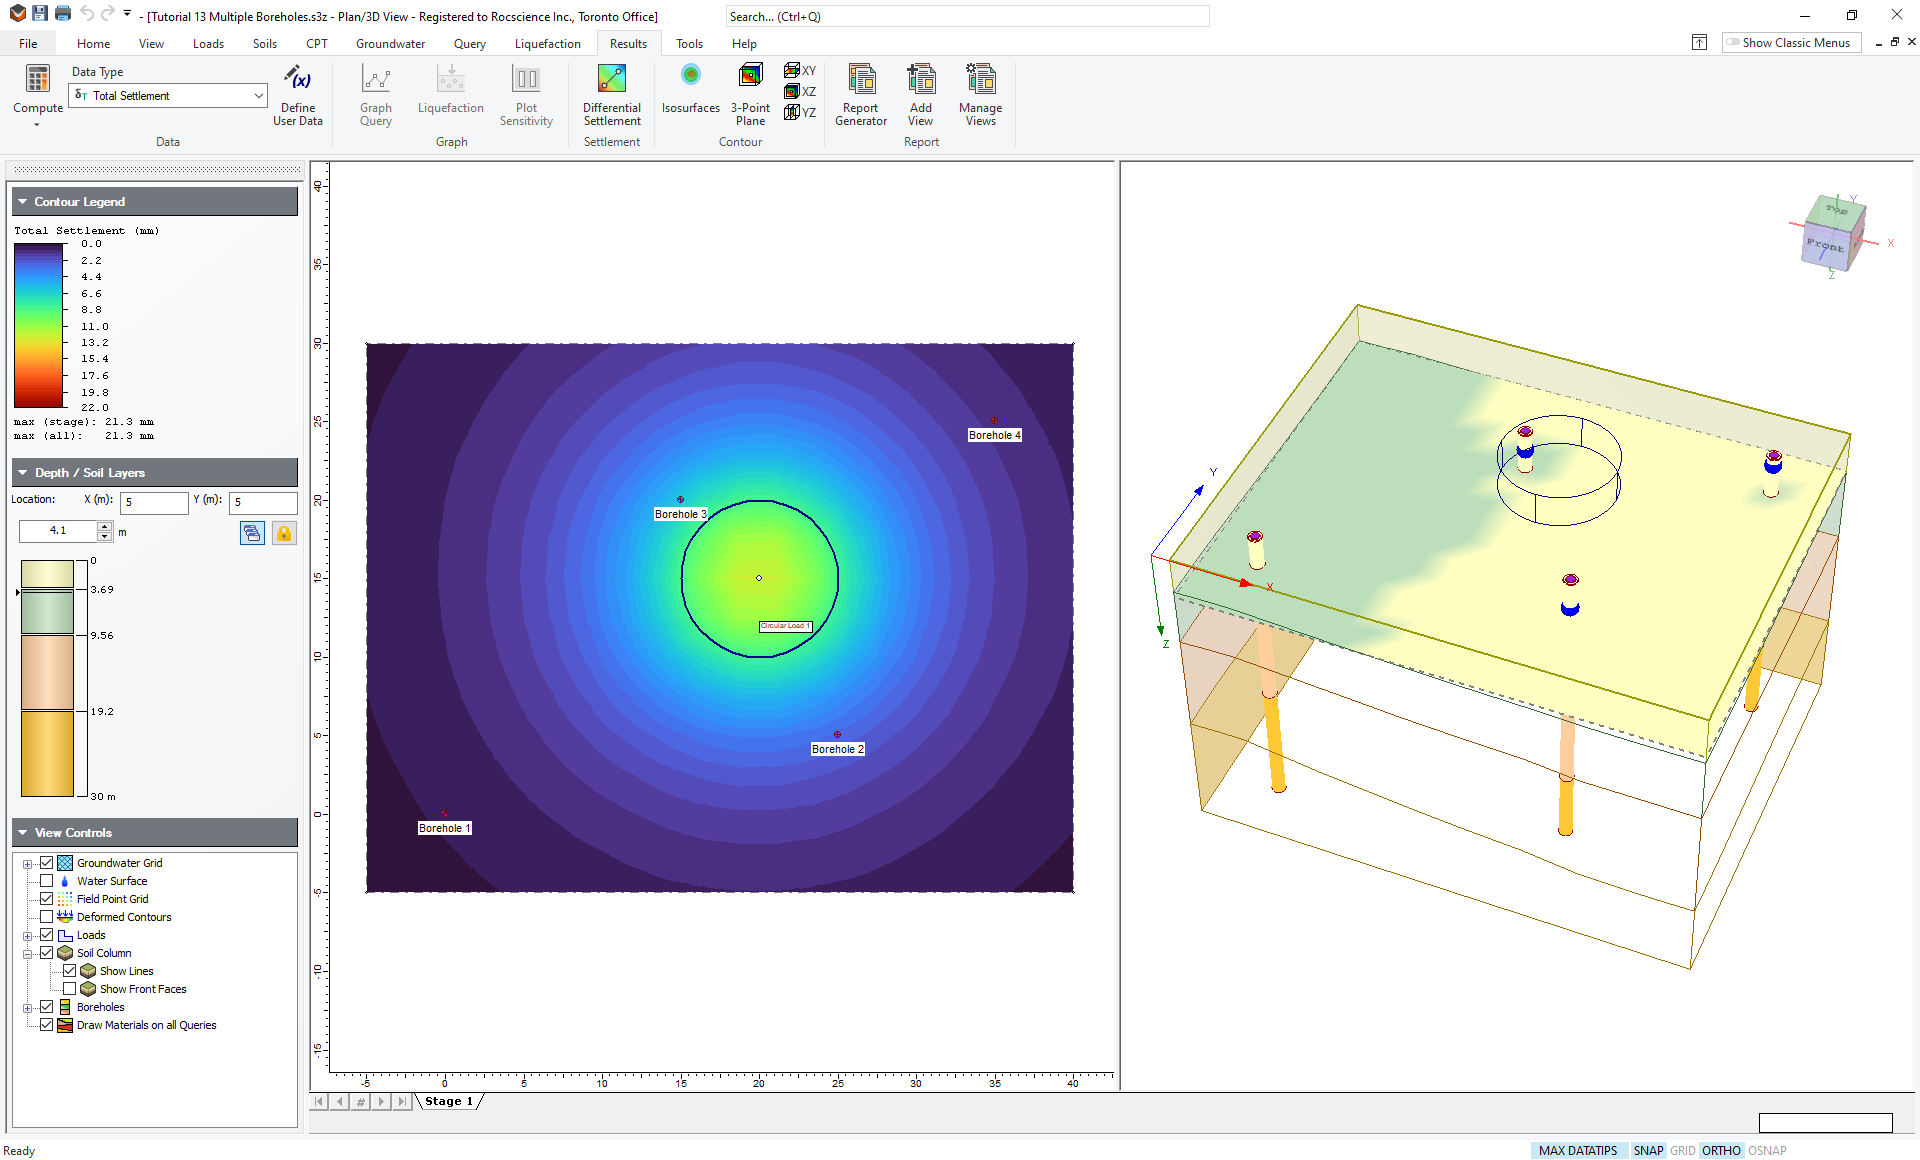
- Click and drag the field point grid, or use the up and down arrow in the Depth/Soil Layers section of the right-side controls to move the grid up and down. Notice how the materials on the Field Point Grid are constantly changing.
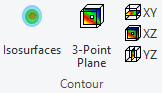
- Select Results > Contours > XZ Query Plane
- Place the plane approximately under the load.
- In the View Controls panel, uncheck the Draw Materials on all Queries checkbox.
When the Draw Materials on all Queries option is deselected, the analysis results are displayed. Query planes can be placed in the XY, XZ, and YZ directions. 3-point planes can also be specified.
This concludes the Multiple Boreholes tutorial; you may now exit the Settle3 program.