3 - Grouped Pile Analysis
1.0 Introduction
This tutorial will demonstrate how to model grouped piles under a cap in RSPile. Before proceeding with the tutorial, make sure you’ve gone through Tutorial 01 - RSPile Quick Start so you’re familiar with the product’s basic functions and features.
Topics Covered in this Tutorial:
- Grouped Pile Analysis
Finished Product:
The finished product of this tutorial can be found in the Tutorial 3 Quick Start - Grouped Pile Analysis.rspile2 data file. All tutorial files installed with RSPile can be accessed by selecting File > Recent Folders > Tutorials Folder from the RSPile main menu.
2.0 Model
When the RSPile program is started, a new blank document is already opened, allowing you to begin creating a model immediately.
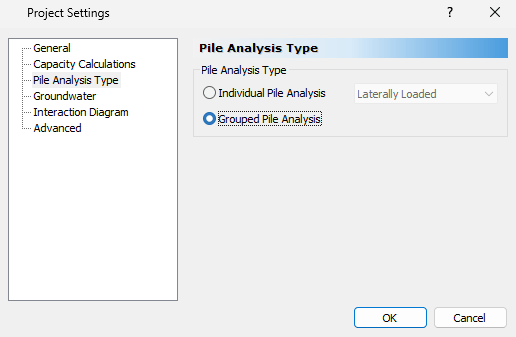
2.1 PROJECT SETTINGS
The Project Settings is where you can change the analysis type, tolerance, number of iterations allowed, and the number of pile segments to be used in the analysis. To open the Project Settings:
- Select Analysis > Project Settings
 (CTRL + J).
 - In the General tab, set the Units to Imperial and Program Mode Selection to Pile Analysis.
- In the Pile Analysis Type tab, set the Pile Analysis Type to Grouped Pile Analysis.
- Click OK to close the dialog.
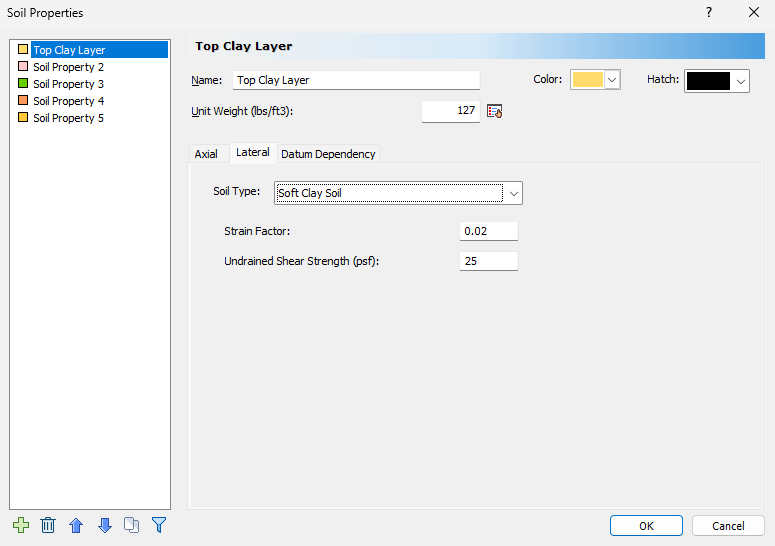
2.3 SOIL PROPERTIES
- Select Soils > Define Soil Properties
 (CTRL + 8).
 - Enter the following properties for Soil Property 1:
- Name = Top Clay Layer
- Unit Weight = 127 lbs/ft3
- Soil Type = Soft Clay Soil
- Strain Factor = 0.02
- Undrained Shear Strength = 25 psf
- Soil Type = API Clay
- Undrained Shear Strength = 25 psf
- Remolded Shear Strength = 20 psf
- Maximum Unit Skin Friction = 1,000,000 psf
- Maximum Unit End Bearing Resistance = 1,000,000 psf
- Enter the following properties for Soil Property 2:
- Name = Sand Layer
- Unit Weight = 127 lbs/ft3
- Soil Type = Sand
- Friction Angle = 30
- Kpy = 5400 lbs/ft3
- Soil Type = API Sand
- Friction Angle = 30 degrees
- Coefficient of Lateral Earth Pressure = 1
- Bearing Capacity Factor = 40
- Maximum Unit Skin Friction = 1,000,000 psf
- Maximum Unit End Bearing Resistance = 1,000,000 psf
- Enter the following properties for Soil Property 3:
- Name = Bottom Clay Layer
- Unit Weight = 127 lbs/ft3
- Soil Type = Modified Stiff Clay without Free Water
- Strain Factor = 0.005
- Undrained Shear Strength = 100 psf
- Initial Stiffness = 200,000 lbs/ft3
- Soil Type = API Clay
- Undrained Shear Strength = 25 psf
- Remolded Shear Strength = 20 psf
- Maximum Unit Skin Friction = 1,000,000 psf
- Maximum Unit End Bearing Resistance = 1,000,000 psf
- Click OK to save your input and close the dialog.
In this dialog you can define the properties related to the Q-z, t-z, and p-y curves. There is a tab for Axial and Lateral as well as for Datum Dependency. The Datum Dependency tab allows users to control linearly varying properties.
We will define three layers using default properties: Clay, Sand, and a Bottom Clay layer.
Lateral tab:
Axial tab:
Lateral tab:
Axial tab:
Lateral tab:
Axial tab:
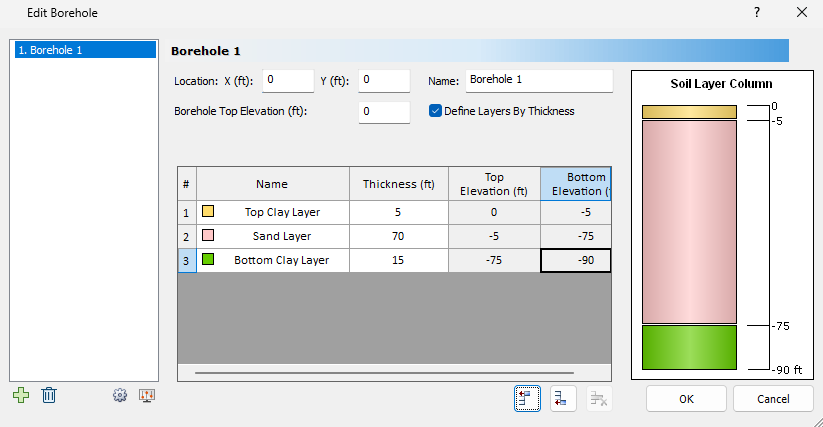
2.4 SOIL LAYERS
RSPile supports multiple boreholes and non-horizontal soil strata. When multiple boreholes are defined, the program will automatically interpolate between the boreholes. In this tutorial, we will model horizontal soil strata with a single borehole. To begin:
- Select Soils > Edit All
 to open the Edit Borehole dialog.
 - Add another two layers below the first by clicking twice on Insert Layer Below
 . The Name column will fill in by soil property sequence.
 - Specify the following layer thicknesses:
- Click OK to save your input and exit the dialog.
The default soil column has a single layer and is located at (0, 0). To change the Location, enter coordinates for X and Y. We will keep it as is.
Layers are defined by thickness by default, but may be defined by top and bottom elevation. This may be changed by toggling Define Layers by Thickness.
# | Name | Thickness | Top Elevation | Bottom Elevation |
1 | Top Clay Layer | 5 | 0 | -5 |
2 | Sand Layer | 70 | -5 | -75 |
3 | Bottom Clay Layer | 15 | -75 | -90 |
The Soil Layer Column on the right side of the dialog will update automatically as layer thicknesses are defined.
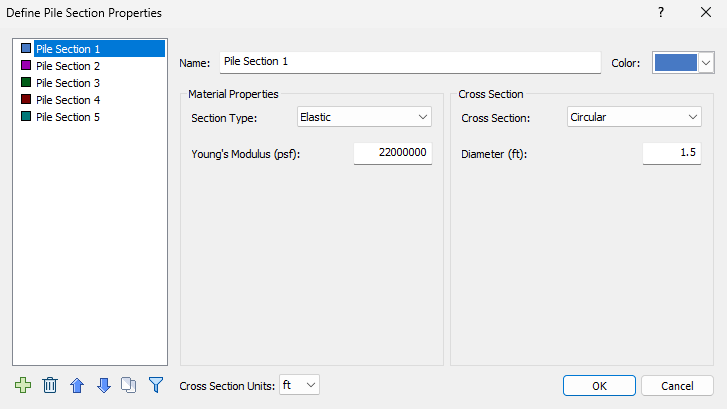
2.5 PILE SECTION PROPERTIES
- Select Piles > Pile Sections

- Select Pile Section 1 and enter the properties displayed in the table below:
- Click OK to save your input and close the dialog.
Name | Cross Section | Type | Diameter (ft) | Young's Modulus (psf) |
Pile Section 1 | Circular | Elastic | 1.5 | 22000000 |
2.6 DEFINING THE GROUP
- Select Piles > Group
 to open the Cap Designer dialog.
We have centralized all aspects of the cap and grouped pile definition in the Cap Designer dialog. In this dialog, the user must define the pile cap geometry, pile pattern, pile connections, and loading on the cap. The Cap Designer has 5 tabs, in which users define the group in its entirety:
- Shape
- Pattern
- Loading
- Connectivity
- Advanced
Each of these tabs are described in detail on the Cap Designer help page.
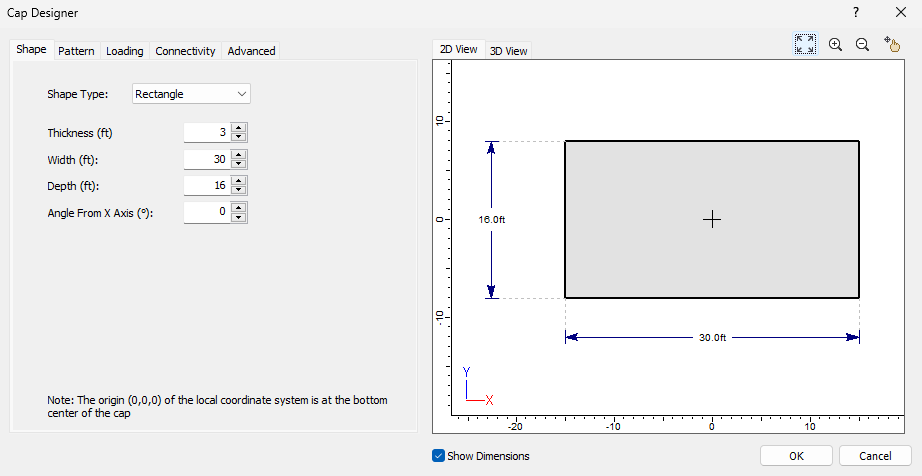
2.6.1 Shape
In the Shape tab we will define a Rectangular cap, as shown below:
Shape Type | Thickness (ft) | Width (ft) | Depth (ft) | Angle from X Axis |
Rectangle | 3 | 30 | 16 | 0 |
2.6.2 Pattern
We will now define a custom pattern of 6 piles using 4 pile types. In the Pattern tab:
- Click the Add
 button to add Pattern 1 and you’ll see the Pattern Options appear. Note that the Pile Type is automatically set to Pile Type 1.
 - Click the Edit
 button for the Pile Type and enter the following properties:
 - For Pattern Type, select Custom from the dropdown.
- Click on the Append Row
 icon and add 2 rows.
 - Enter the following coordinates for the piles:
- Pile 1: x = 7.5, y =3
- Pile 2: x = 7.5, y = -3
- Add 3 more Patterns using the below properties:
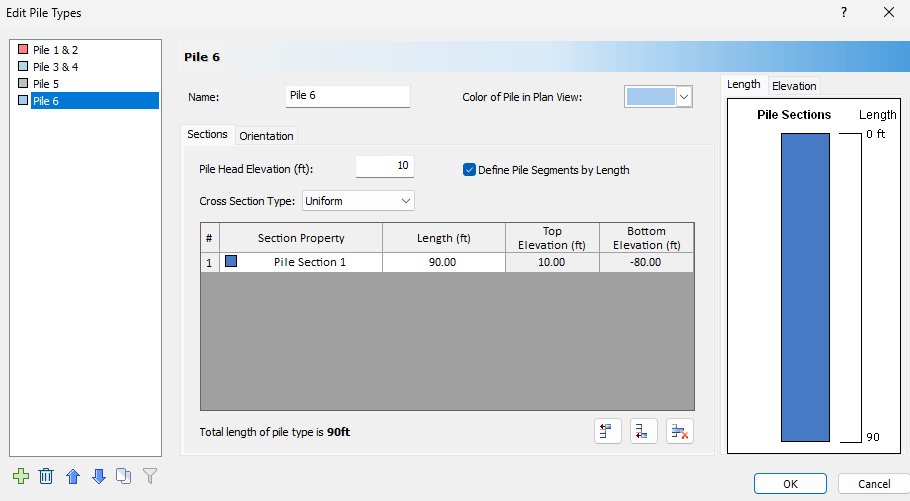
| Sections | Orientation | ||||
| Name | Pile Head Elevation (ft) | Length | Alpha Angle | Beta Angle | Rotation Angle |
| Pile 1 & 2 | 10 | 90 | 0 | 80 | 0 |
| Pile 3 & 4 | 10 | 90 | 180 | 80 | 0 |
| Pile 5 | 10 | 90 | 90 | 76 | 0 |
| Pile 6 | 10 | 90 | 270 | 76 | 0 |
| Pattern # | Pile type | Pattern Type | Pile | X | Y |
| 1 | Pile 1-2 | Custom | 1 | 7.5 | 3 |
2 | -7.5 | 3 | |||
| 2 | Pile 3-4 | Custom | 3 | 7.5 | -3 |
4 | -7.5 | -3 | |||
| 3 | Pile 5 | Custom | 5 | 10.5 | 0 |
| 4 | Pile 6 | Custom | 6 | -10.5 | 0 |
You’ll notice now that the Connectivity tabs has a * next to its name. You must go through *starred tabs before closing the dialog to ensure you have fully defined the pile and cap. We will address this tab after adding the Load.
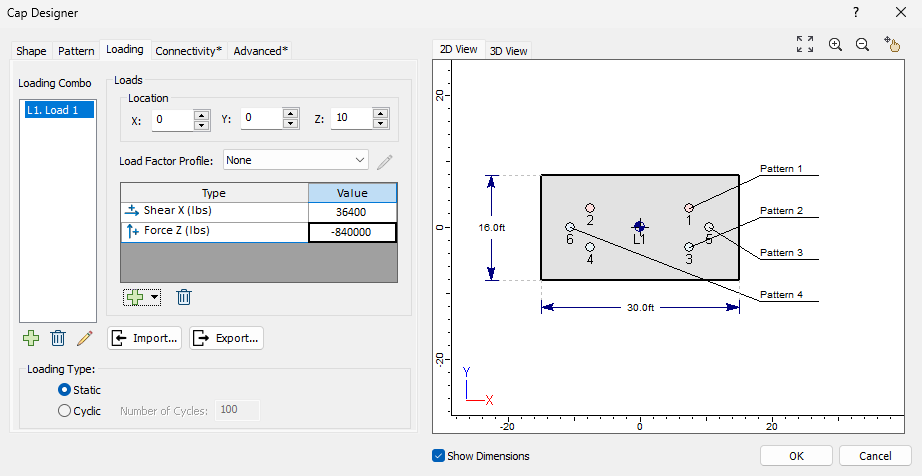
2.6.3 Loading
- Go to the Loading tab.
- Click on the Add button to add a Loading Combination.
- Enter the below values:
Multiple loads can be added. For each load, the following must be defined: Location, Type (Moment, Shear, Axial), and Value. A Load Factor Profile can also be added, though we will not explore this feature here.
Location:
- X=0
- Y=0
- Z=10
Type | Value |
Shear X (lbs) | 36400 |
Force Z (lbs) | -840000 |
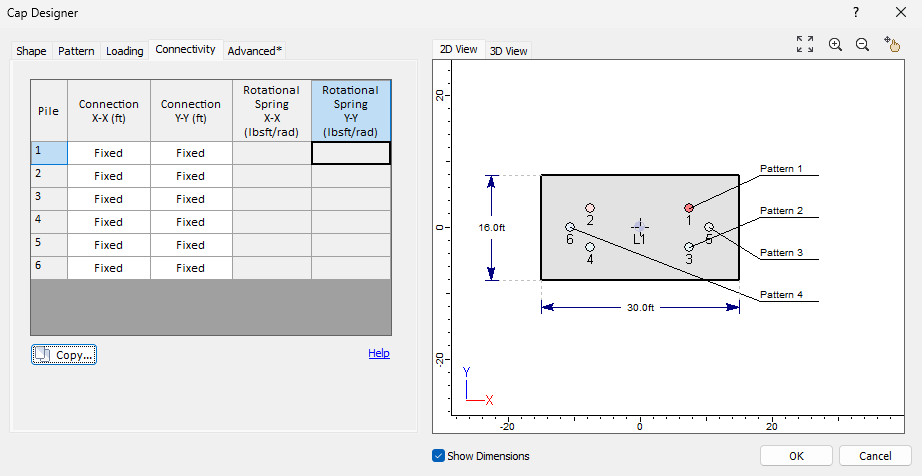
2.6.4 Connectivity
- Select the Connectivity tab.
This is where the pile head to cap connection is defined. The following options are available:
- Pinned
- Fixed
- Restrained (Elastically Restrained) – if this connection type is selected, a Rotational Spring Stiffness value must be defined.
For this tutorial we will be setting all connections to be Fixed. Notice that when you click on each pile to define the connection types, the pile will be highlighted in the view on the right.
- Set the Connection types for Pile 1 to Fixed and Fixed.
- Click on Copy to assign the same connection type to all the other piles. The following dialog will appear:
- Click on Select All.
- Click OK to close the dialog.
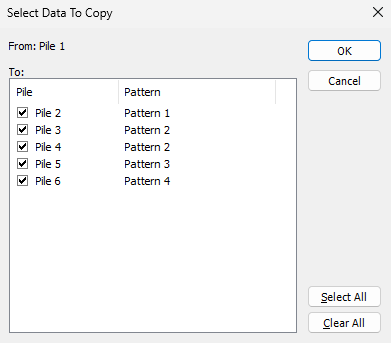
The Connection type for all of piles should now say Fixed.
2.6.5 Advanced
In the Advanced tab we define the pile lengths and orientations. At this point it is useful to switch to the 3D View. There are 3 dropdown options in the Advanced tab:
- Pile Type - this is where different pile type can be assigned to individual piles
- Multipliers – this is where p-y, t-z and q-z multipliers can be defined and assigned to individual piles.
- Group Effect – Axial and Lateral coefficients, to account for the behavior of piles in closely-spaced groups, can be defined here. Coefficients can be assigned to individual piles. Axial Coefficients are entered manually. Lateral Coefficients can be entered manually, or the Automatic option can be used.
We will not edit the inputs found under this tab.
- Click OK to save your input and close the dialog.
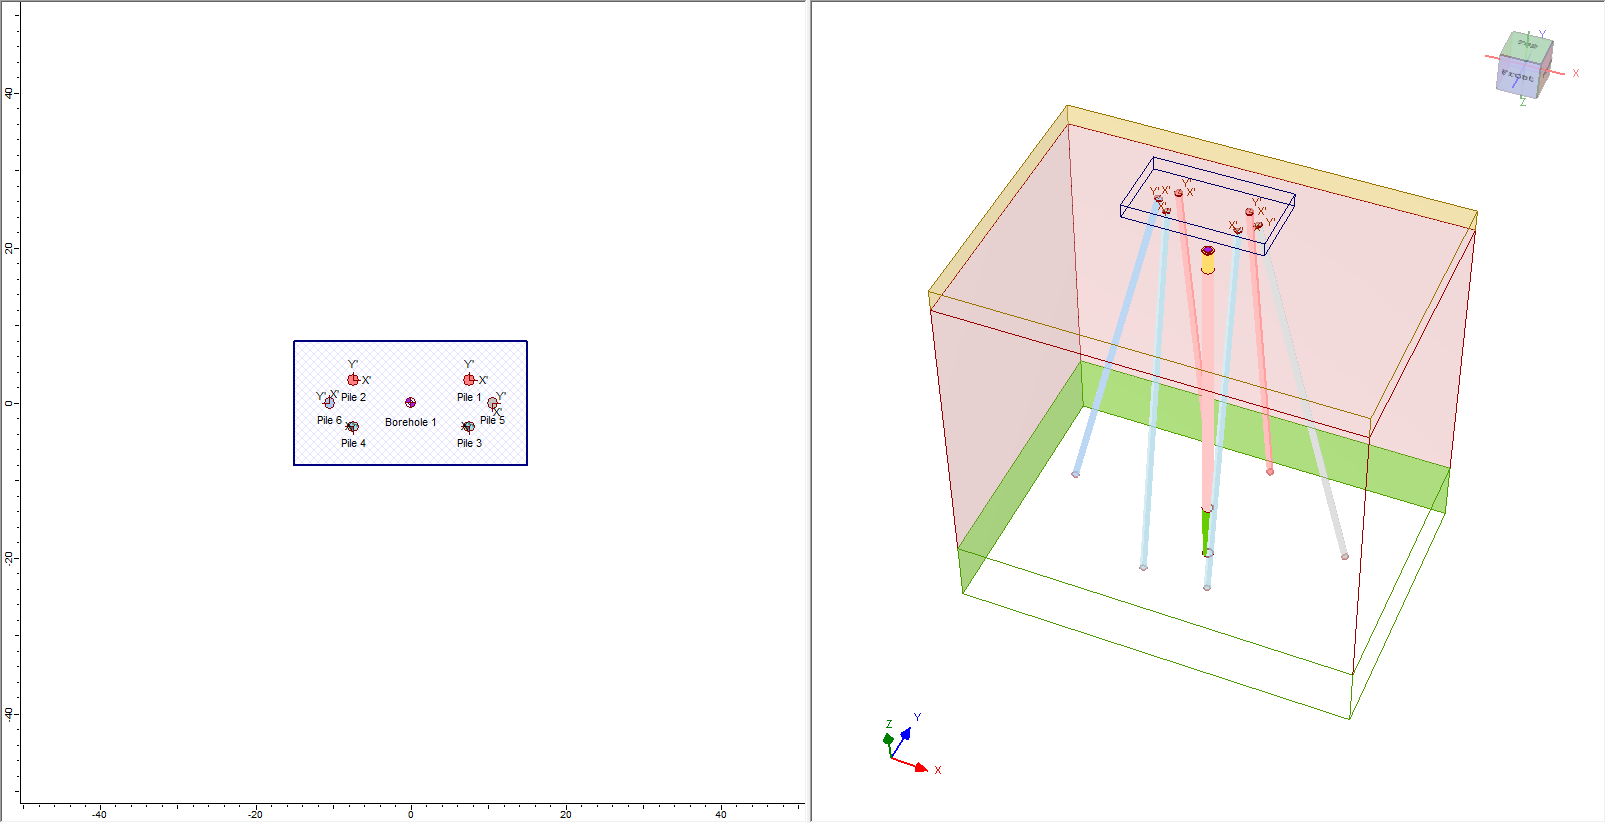
2.6.6 Placing the Pile Group
After clicking OK, you will be prompted to place the cap in the model, either by entering the (x,y) coordinates in the prompt in the bottom right of the screen or using the mouse.
- Enter Location = (0,0) and press Enter.
- You will now be asked for an elevation. Enter Elevation = 10 ft.
- Click OK to enter the elevation and close the dialog.
You should now see the following 2D and 3D views:
3.0 Results
- Save and compute the file by selecting Results > Compute

3.1 RESULTS VISUALIZATION
RSPile allows for the 3D visualization of results along the length of the pile.
Pile Results may be toggled on or off using the View Controls in the sidebar.
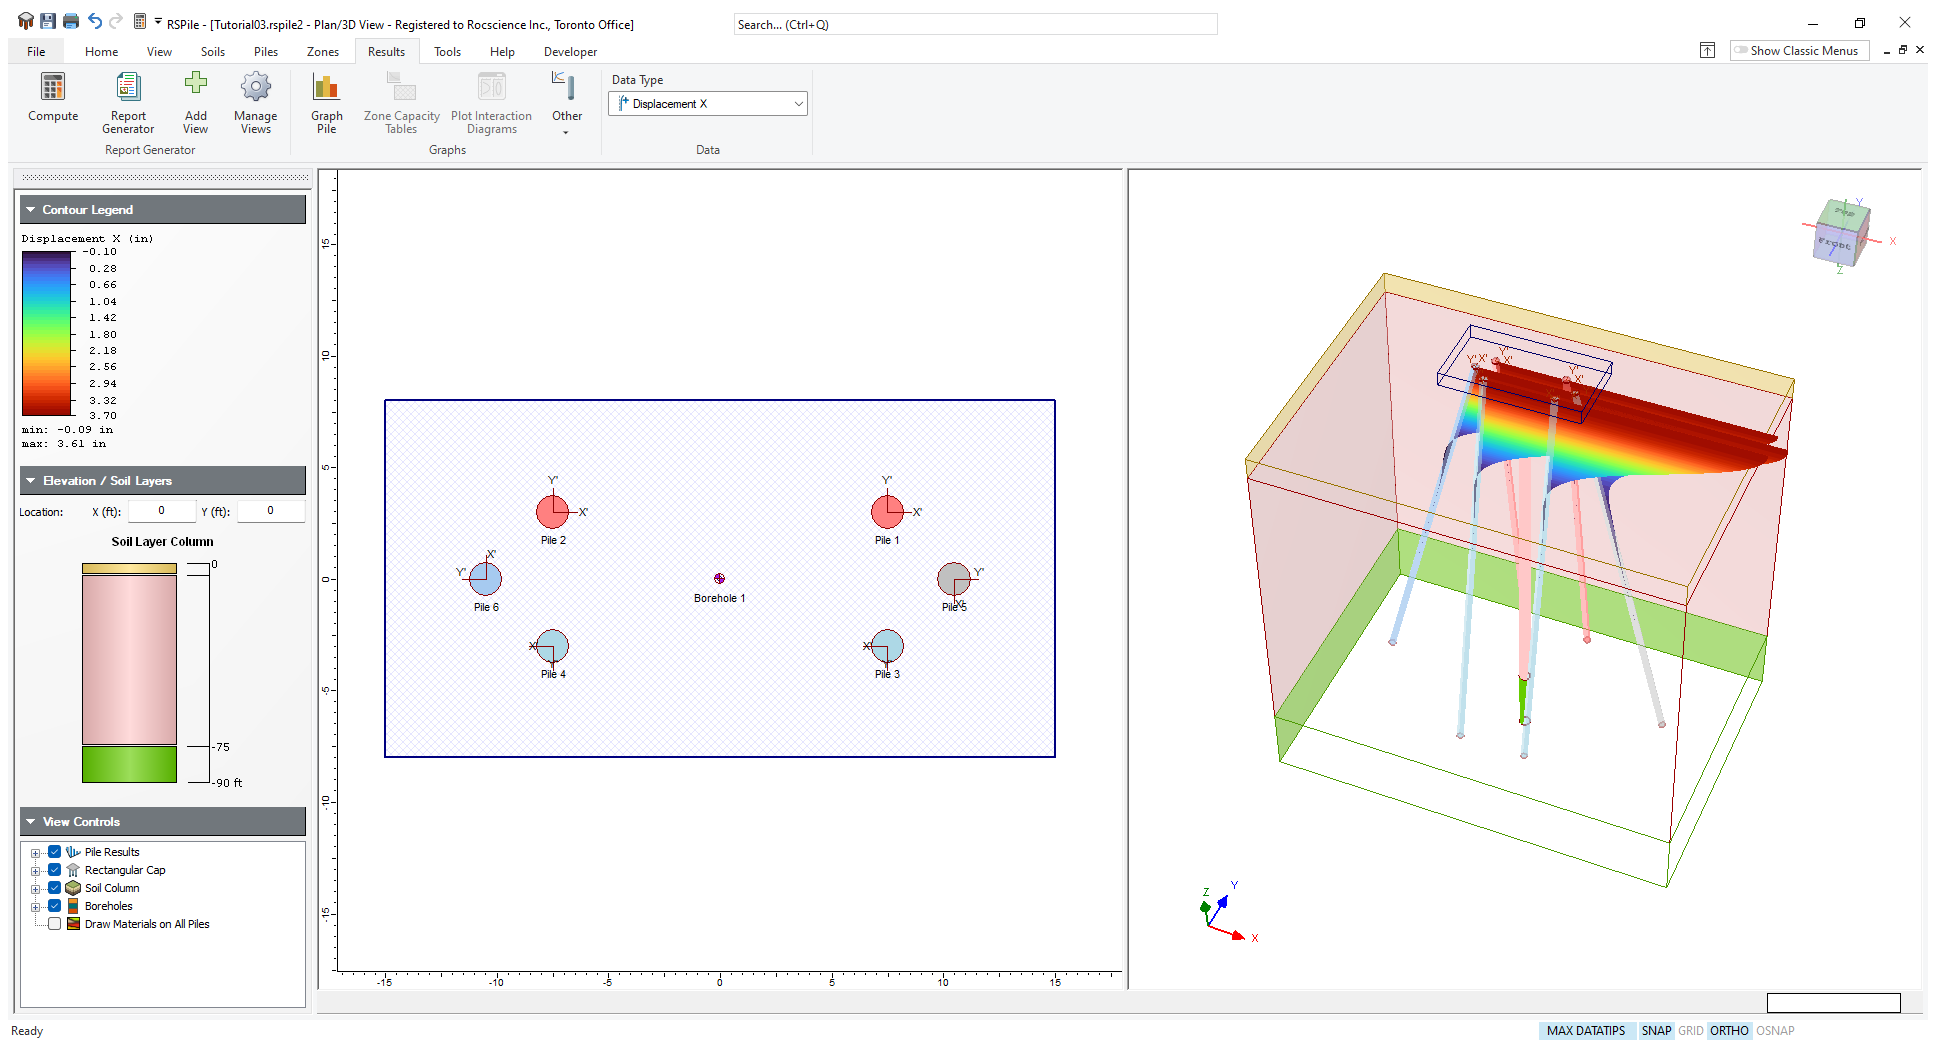
Use the Data Type drop down to control what results are shown. Displacement X is shown by default.
The following results are available:
- Displacement X
- Displacement Y
- Displacement Z
- Rotation X
- Rotation Y
- Rotation Z
- Beam Shear Force X'
- Beam Shear Force Y'
- Beam Axial Force
- Beam Moment X'Z'
- Beam Moment Y'Z'
- Soil Reaction Force X'
- Soil Reaction Force Y'
- Soil Reaction Force Z'
- Soil Stiffness X'
- Soil Stiffness Y'
- Soil Stiffness Z'
- Skin Friction
- End Bearing
3.2 CHARTS
- Select Results > Graph Pile

- In the Plan View, use your mouse to select all six piles.
- Press Enter.
The Results tab will open and the results for all 6 piles will be graphed together.
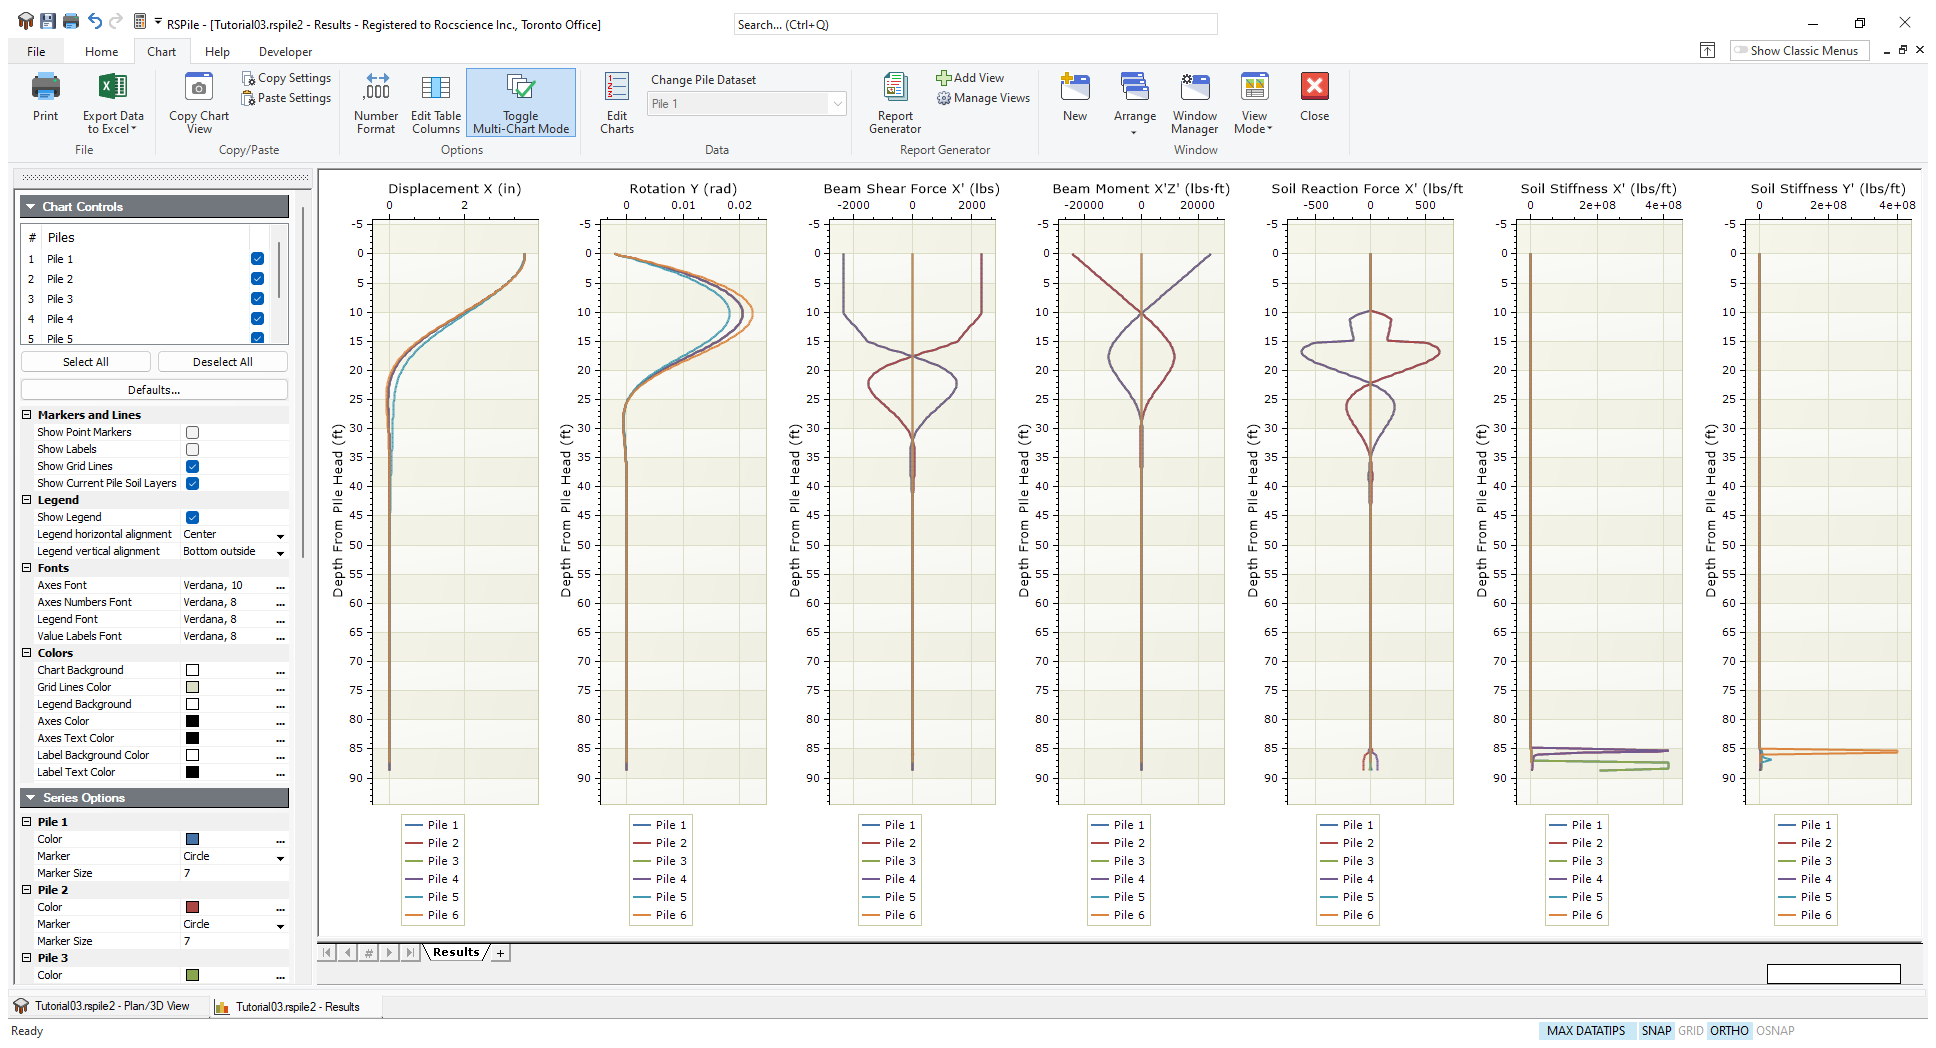
The side panel houses the control options for the charts. Markers, Legends, Axes, Colors can all be customized. In the Chart Controls you can also use checkboxes to specify which piles you want to appear in the charts.
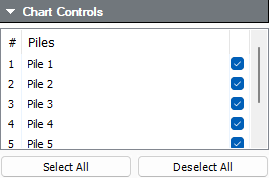
The charts are automatically updated as you check and uncheck these boxes.
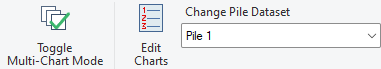
If you uncheck the Toggle Multichart Mode  option in the toolbar the Pile dropdown will become available and you’ll be able to choose between the results of individual piles.
When you are looking at the results of individual piles, the tabular results are often shown at the bottom of the window. If you want to hide this results and maximize the charts view, click on the View Mode  button on the toolbar.
Below are other useful options for viewing and customizing results:
- The charts order and visible results can be set in the Edit Charts dialog. You can access this by clicking on the Edit Charts
 button on the toolbar.
 - The number format in the grid can be switched between Decimal and Scientific, and the number of decimal places can be specified in the Number Format dialog. You can access this by clicking on the Number Format
 button on the toolbar.
 - The results shown in the tabular results section can be selected in the Edit Table Columns dialog, accessed by clicking on the Edit Table Columns
 button in the toolbar. The Match to charts button allows you to sync the tabular results to the displayed chart results.
 - Results can be exported to Excel by clicking on the Export Data to Excel
 button in the toolbar. By clicking on the dropdown arrow users can choose between two options, Shown Data and All Data.
4.0 Report Generator
The Report Generator presents a formatted summary of input data and analysis results.
- Go back to the model view and click on the Report Generator
 icon in the toolbar.
 - Project Summary
- Results
- Cap Results
- Cap Pile Results
- Soil Layers
- Soil Properties
- Pile Section Properties
- Pile Type
- Cap Settings
- Shape information and diagram of pile and cap setup
- Pile Locations and Pile Orientations
- Click on the Close Window
 button from the Report Generator toolbar to close the viewer and return to the model view.
The Report Generator contains a summary of the model input data:
The tool bar contains the Report Generator Controls, which allow you to select what information is displayed, and customize the appearance.
The data can be exported in a variety of ways: it may be manually copied, viewed in a browser, printed, or the information may be saved as a .pdf file. Prior to printing the file, results may be formatted to your specifications.
This concludes the Grouped Pile Analysis Tutorial. You may now exit the RSPile program.