Rocscience International Conference 2025 is going to take place in Sydney, Australia Read more

Search Results

Stress Path Graphs

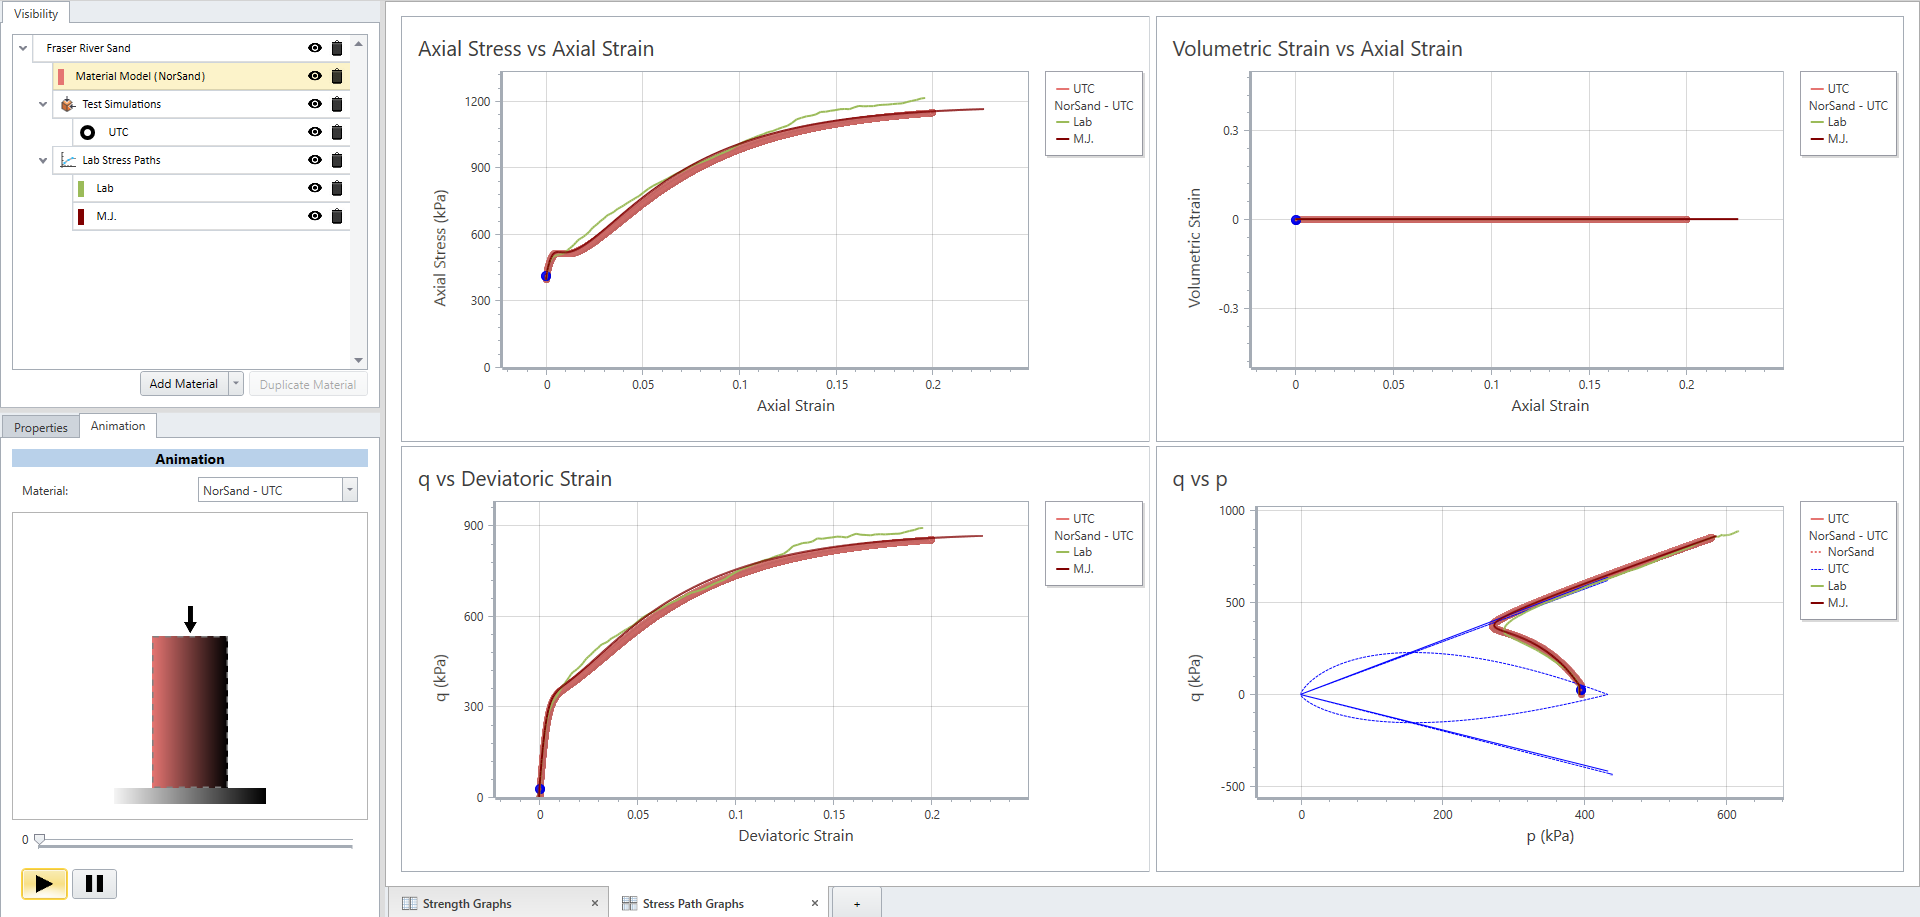
Users can see the stress paths displayed in the stress path graph tab as shown below. By default, users will see the four graphs with variables per axial / deviatoric strain and q vs p graph. You can right click on the graph and define the parameters you want to change in the graph. Stress path graphs

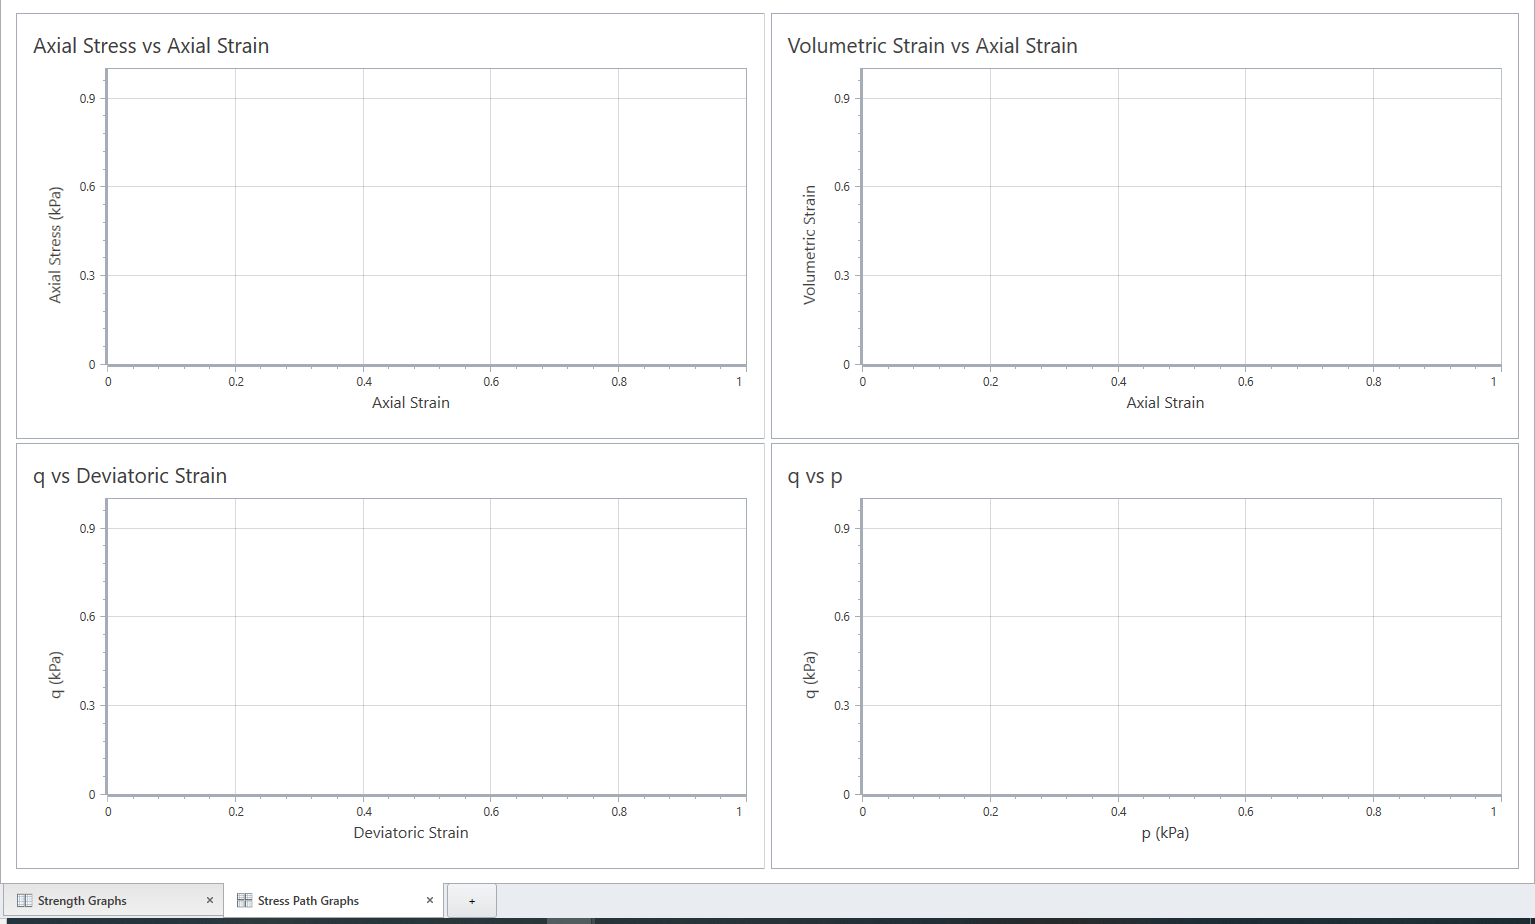
After user assigns the Define Stress Paths and Apply Stress Paths to the material model, the following graphs will plot the stress paths as shown below:Graphs plotting stress paths

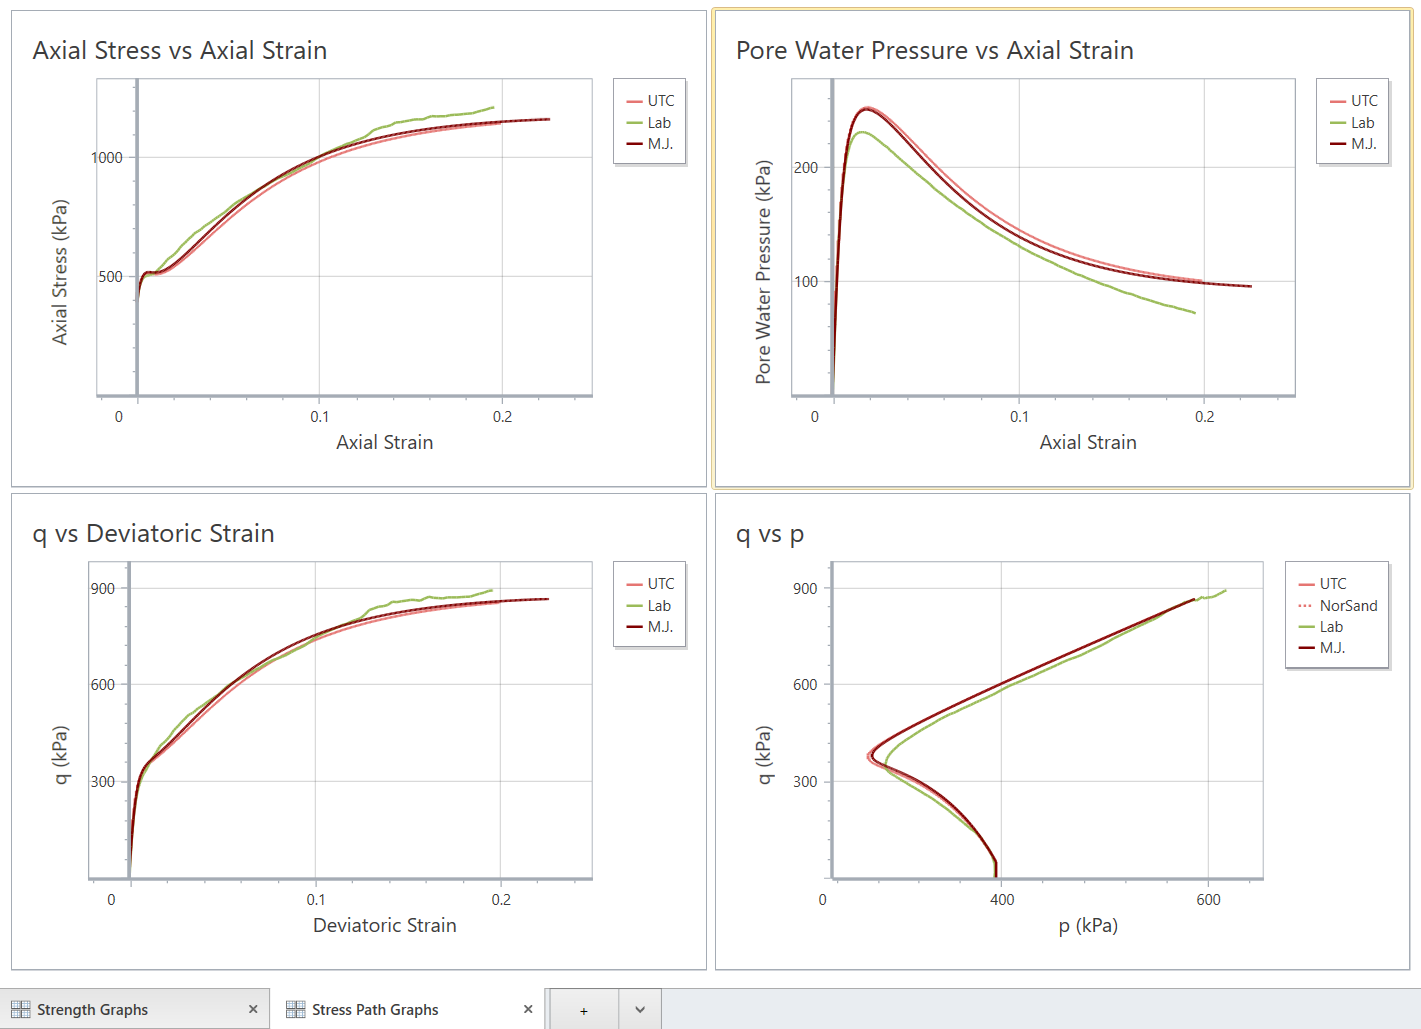
More details on graphs and options in Stress Path Graph can be found in our tutorials: Norsand and CamClay tutorials. This graph is generally used for constituitive behavior of soil. There is also animation tab available for stress path where the progression of load applied will be animated in the graph with bounding surface.

Stress path animation

Rocscience logo, click here to return to the homepage Portal Account Portal Account Log In Log Out Home Shopping Cart icon Click here to search our site Click here to close Learning Tech Support Documentation Info Chevron Delete Back to Top View More" Previous Next PDF File Calendar Location Language Fees Video Click here to visit Rocscience's LinkedIn page Click here to visit Rocscience's YouTube page Click here to visit Rocscience's X page Click here to visit Rocscience's Facebook page Click here to visit Rocscience's Instagram page Click here to visit Rocscience's Reddit page Bookmark Network Scroll down for more Checkmark Download Print Back to top Single User Multiple Users RSLog RocFall3 CPillar Dips EX3 RocFall RocPlane RocSlope3 RocSupport RocTopple RS2 RS3 RSData RSPile Settle3 Slide2 Slide3 SWedge UnWedge RocTunnel RocSlope2 Commercial License Education License Trial License Shop safe & secure Money-back guarantee