Rocscience International Conference 2025 is going to take place in Sydney, Australia Read more

Search Results

Strength Graphs

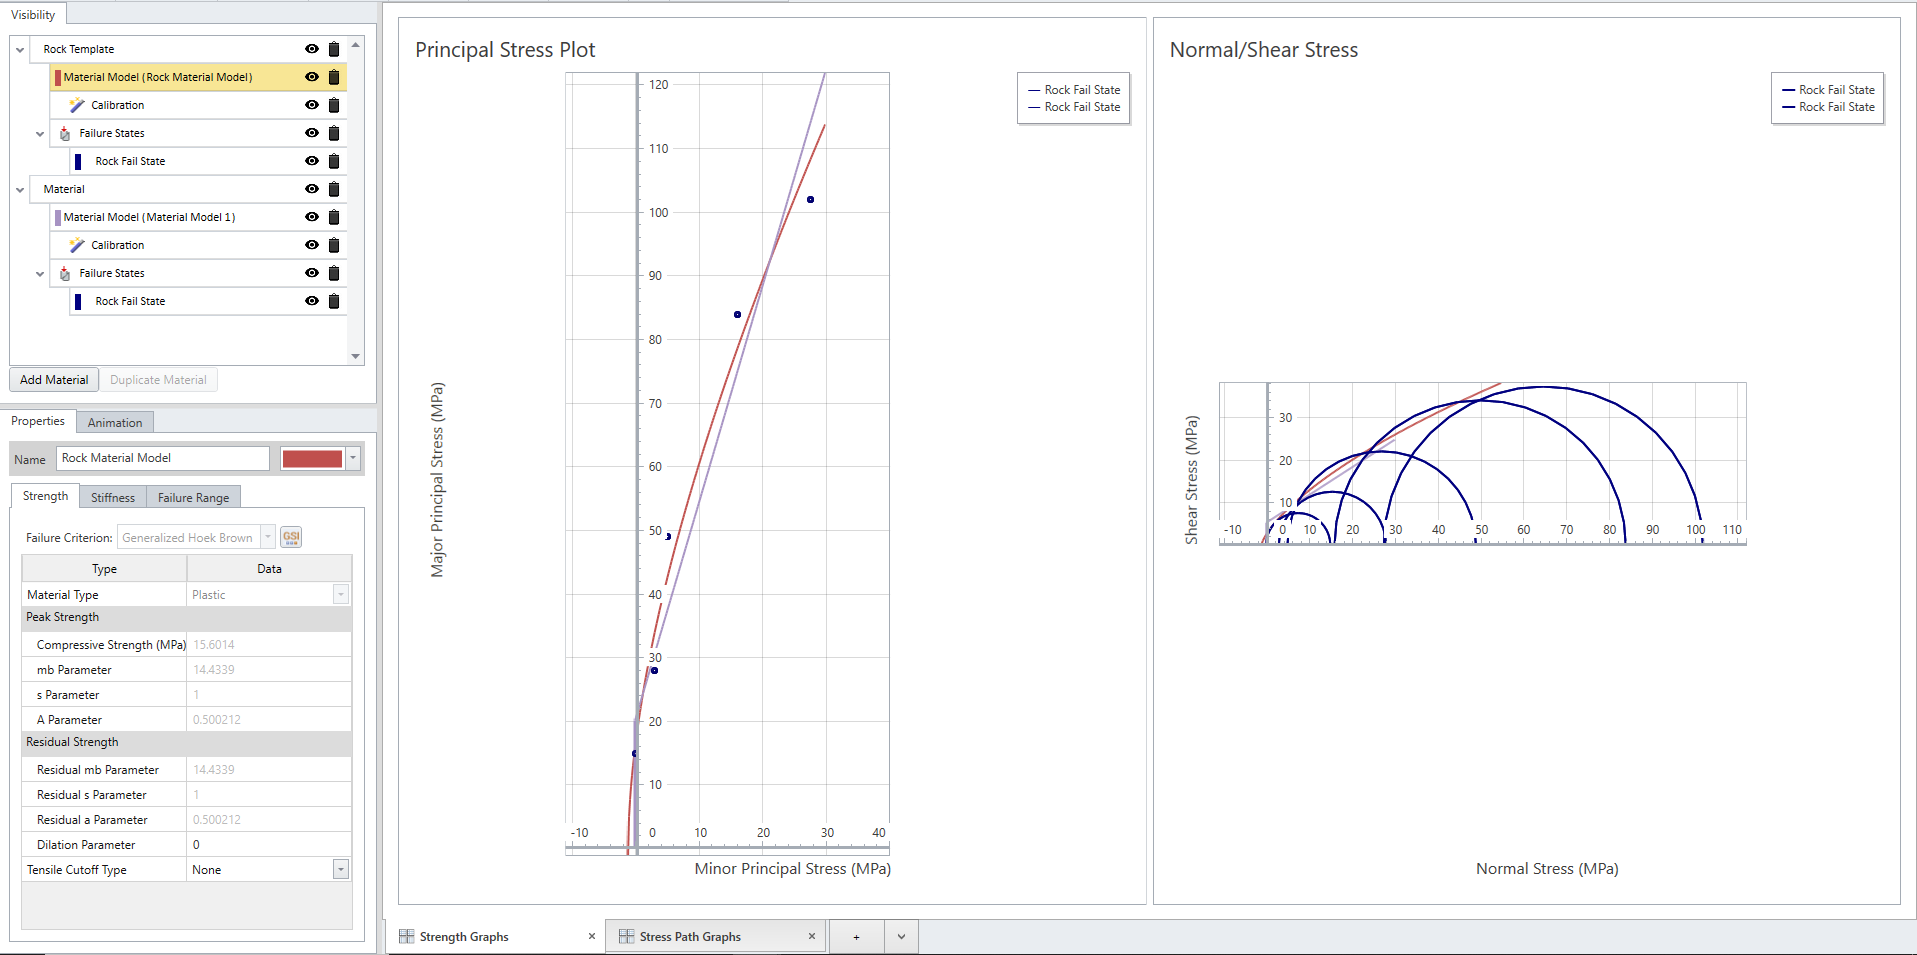
Strength graphs allows you to see the principal stress and Normal/Shear Stress plot as shown below:Strength graphs

The principal stress plot shows major principal stress and minor principal stresses, whereas normal/shear stress graph shows shear stress and normal stresses for the axis. Below shows an example of the two graphs updated with Mohr-Coulomb and generlized Hoek-brown models.

Principle stress plot

Rocscience logo, click here to return to the homepage Portal Account Portal Account Log In Log Out Home Shopping Cart icon Click here to search our site Click here to close Learning Tech Support Documentation Info Chevron Delete Back to Top View More" Previous Next PDF File Calendar Location Language Fees Video Click here to visit Rocscience's LinkedIn page Click here to visit Rocscience's YouTube page Click here to visit Rocscience's X page Click here to visit Rocscience's Facebook page Click here to visit Rocscience's Instagram page Click here to visit Rocscience's Reddit page Bookmark Network Scroll down for more Checkmark Download Print Back to top Single User Multiple Users RSLog RocFall3 CPillar Dips EX3 RocFall RocPlane RocSlope3 RocSupport RocTopple RS2 RS3 RSData RSPile Settle3 Slide2 Slide3 SWedge UnWedge RocTunnel RocSlope2 Commercial License Education License Trial License Shop safe & secure Money-back guarantee