Sampling Method
The sampling options used in a Probabilistic analysis in RocTopple are determined by the Sampling Method and Number of Samples settings in the General tab of the Project Settings dialog. To enable the options:
- Select Project Settings
 on the toolbar or on the Analysis menu.
 - Set Analysis Type = Probabilistic.
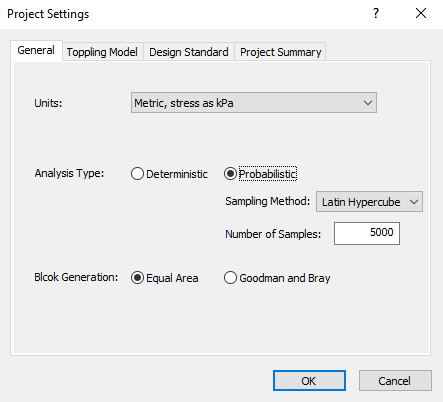
The available options are:
- Sampling Method
- Number of Samples
Sampling Method
The Sampling Method determines how the statistical input distributions for the random variables you have defined for a Probabilistic analysis will be sampled. Two methods are available in RocTopple:
- Monte Carlo
- Latin Hypercube (the default)
NOTE: For both methods, a constant seed value is used to generate sequences of random numbers to generate the sample values. This is referred to as pseudo-random sampling, which allows you to obtain reproducible results for a Probabilistic analysis.
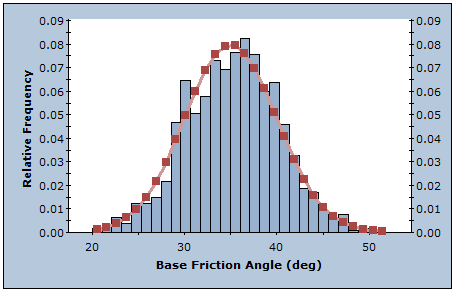
MONTE CARLO METHOD
The Monte Carlo method uses random numbers to sample from the input data probability distributions. Monte Carlo techniques are commonly applied to a wide variety of problems involving random behavior in geotechnical engineering.
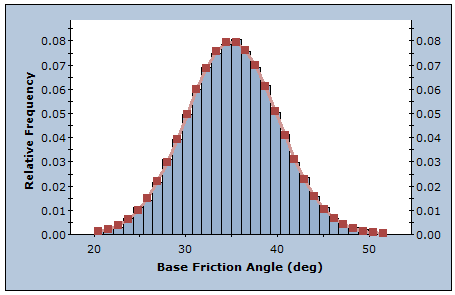
LATIN HYPERCUBE METHOD
The Latin Hypercube method is the default selection and gives comparable results to the Monte Carlo technique, but with fewer samples [Iman et.al. (1980), Startzman et.al. (1985)]. The method is based upon stratified sampling with random selection within each stratum. This results in a smoother sampling of the probability distributions. Typically, an analysis using 1000 samples obtained by the Latin Hypercube technique produces comparable results to an analysis of 5000 samples using the Monte Carlo method [Hoek et.al. (1995)].
Number of Samples
The Number of Samples that are generated for each random variable in a Probabilistic analysis. For example, if Number of Samples = 1000, 1000 values of each input data random variable (e.g., Base Friction Angle) are generated according to the Sampling Method and statistical distribution for each random variable. The analysis is run 1000 times and a Factor of Safety is calculated for each set of input data samples. This results in a distribution of Factors of Safety from which the Probability of Failure is calculated.