3 - Voussoir Analysis of Rectangular Roof Plate
In Tutorial 01 - CPillar Quick Start (Rigid Analysis of Square Pillar), you learned about the Rigid analysis method in CPillar. In Tutorial 02 - Elastic Analysis of Rectangular Roof Beam, you learned about the Elastic analysis method. In this tutorial, you will learn about the Voussoir analysis method.
Topics Covered in this Tutorial:
- Project Settings
- Random Variables
- Rectangular Roof Plate Model
- Voussoir Analysis
- Mohr-Coulomb Strength Criterion
- Probabilistic Analysis
- Arch Snap-thru Theory
Finished Product:
The finished product of this tutorial can be found in the Tutorial 03 Voussoir Analysis of Rectangular Roof Plate.cpil5 file, located in the Examples > Tutorials folder in your CPillar installation folder.
1.0 Introduction
This model represents a rectangular roof plate (30 x 20 m) with a thickness of 2.5 m.
The Voussoir analysis method will be used. The Voussoir method is applicable for low confining stresses. A span to depth ratio smaller than 3 is not recommended. External lateral stress is not an option for a Voussoir analysis. Lateral stress exists, but it is induced by the ‘arching’ action of the rock, it is not an input parameter.
The Mohr-Coulomb strength criterion will be used. Cohesion is automatically set to zero for a Voussoir analysis when using the Mohr-Coulomb strength criterion. Only a Friction Angle is entered.
2.0 Creating a New File
If you have not already done so, run the CPillar program by double-clicking the CPillar icon in your installation folder or by selecting Programs > Rocscience > CPillar > CPillar in the Windows Start menu.
When the program starts, a default model is automatically created. If you do NOT see a model on your screen:
- Select: File > New

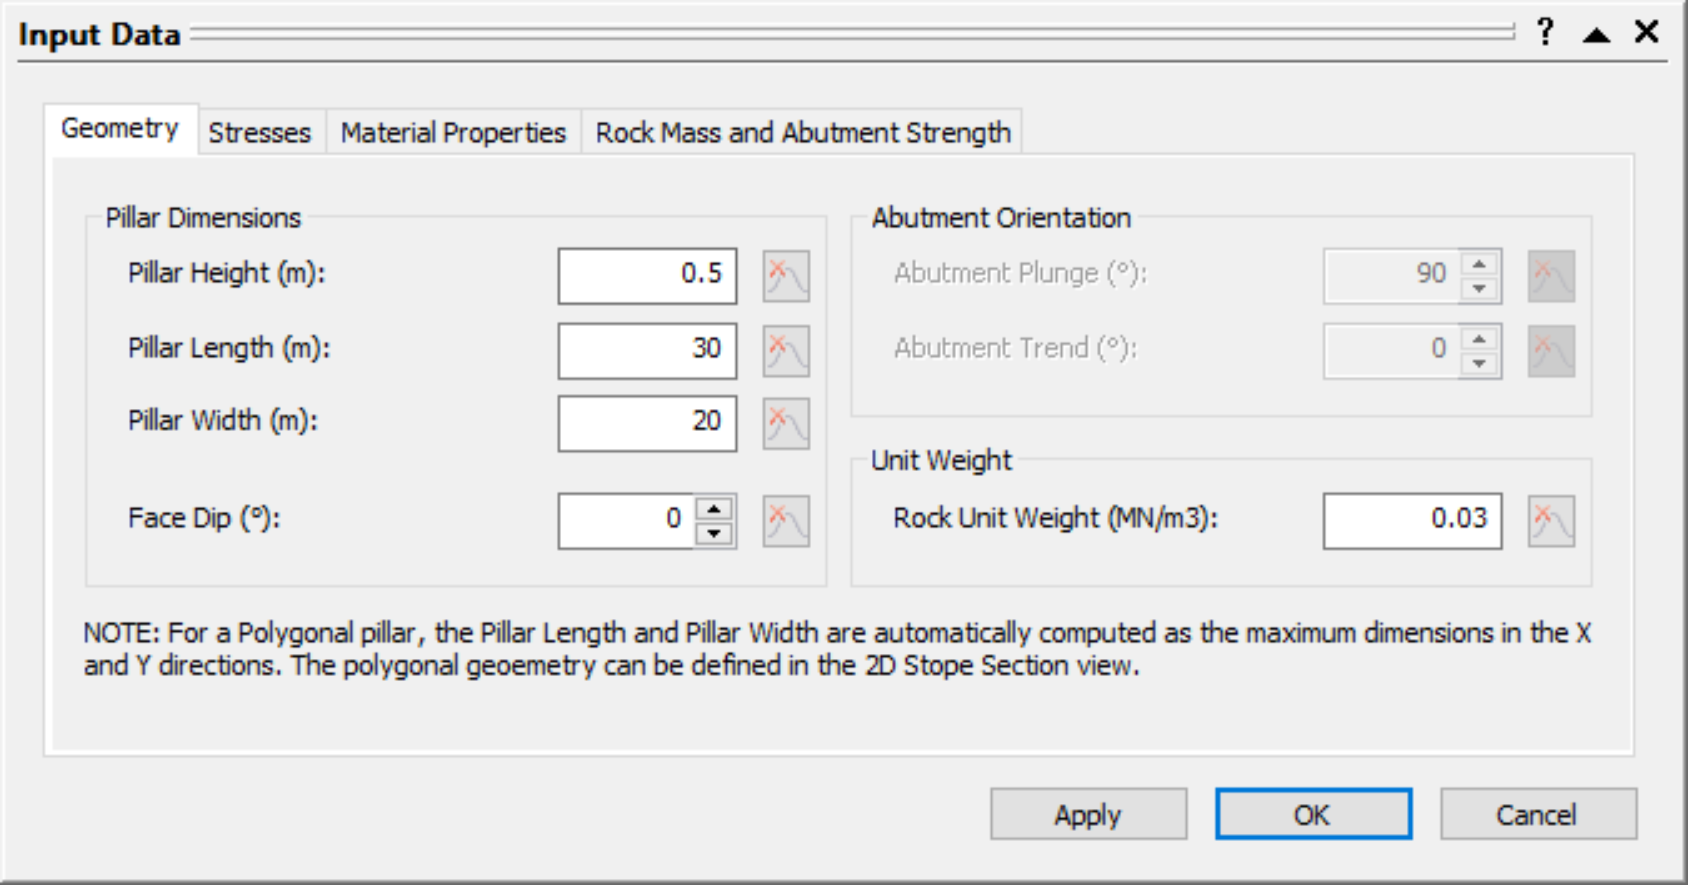
Whenever a new file is created, the default input data forms valid pillar geometry, as shown in the image below.
If the CPillar application window is not already maximized, maximize it now so that the full screen is available for viewing the model. You will have a 3D pillar displayed on the screen in isometric orientation.
3.0 Project Settings
The Project Settings dialog allows you to configure the main analysis parameters for your model, such as Units, Analysis Type, and Sampling Method.
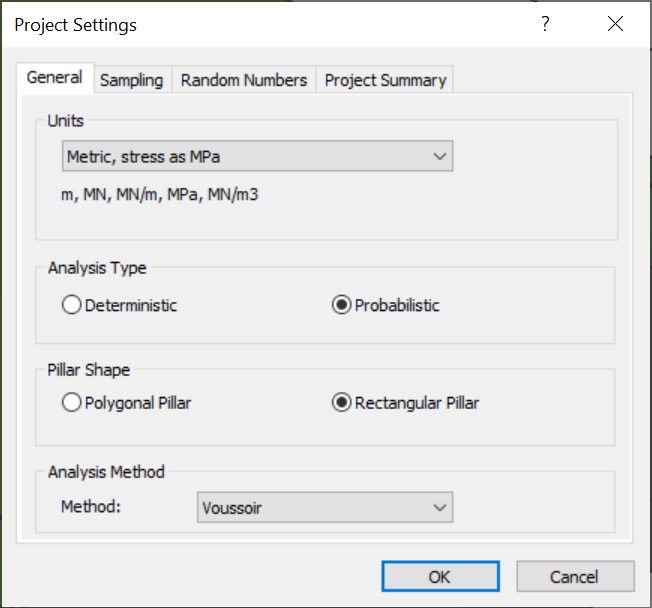
3.1 General
To open the Project Settings dialog:
- Select Project Settings
 from the toolbar or the Analysis menu.
 - Navigate to the General tab.
- Ensure Units = Metric, stress as MPa (default setting).
- Set Analysis Type = Probabilistic.
- Set Pillar Shape = Rectangular Pillar.
NOTE: The Voussoir analysis is formulated for a rectangular pillar. Therefore, the Pillar Shape must be set to Rectangular Pillar. - Set Analysis Method = Voussoir.
3.2 Sampling
The Sampling Method determines how the statistical distribution for the random input variables will be sampled. For each sample, the computed Factor of Safety is compared against the Design Factor of Safety to determine the Probability of Failure for all samples. Any computed Factor of Safety < Design Factor of Safety is considered a failed pillar for the applicable failure mode. Unlike the Design Factor(s) of Safety, the Design Buckling Parameter is an upperbound threshold. Any computed Buckling Parameter > Design Buckling Parameter is considered a failed pillar.
- Navigate to the Sampling tab of the Project Settings dialog.
- Leave the default values.
Sampling Method = Latin HyperCube
Number of Samples = 5000
Design Shear Factor of Safety = 1
Design Compression Factor of Safety = 1
Design Buckling Parameter = 35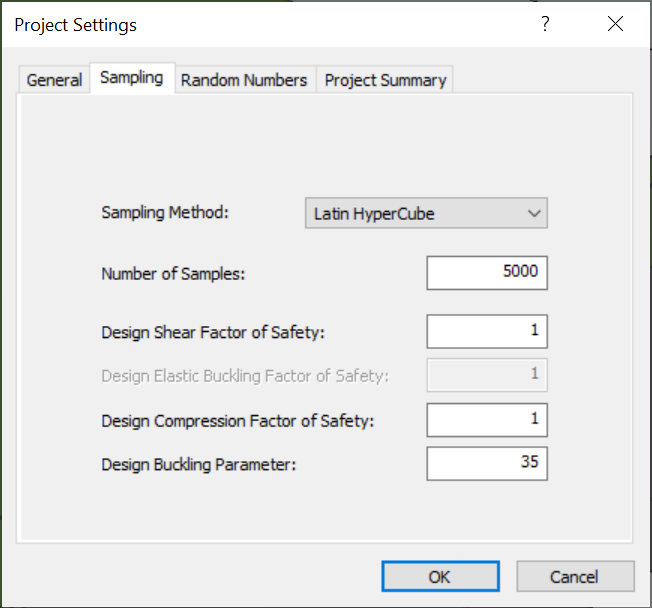
3.3 Project Summary
- Navigate to the Project Summary tab of the Project Settings dialog.
- Enter CPillar Voussoir Analysis of Rectangular Roof Plate Tutorial as the Project Title.
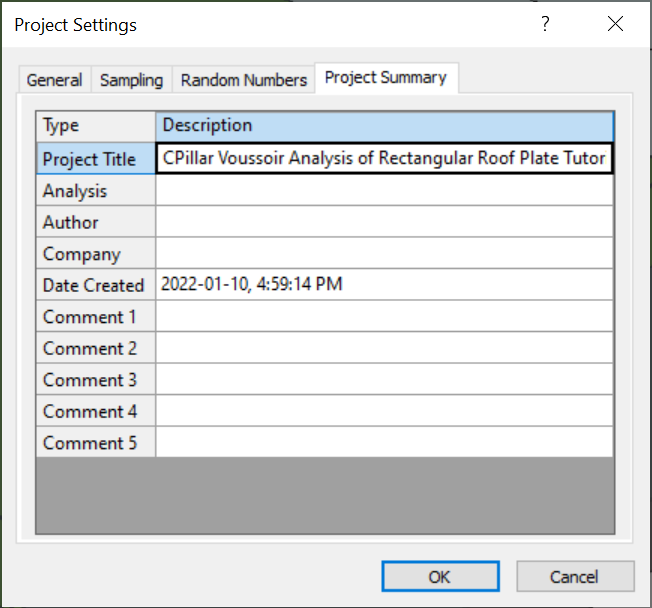
- Click OK to close the Project Settings dialog.
4.0 Mean Input Data
Autocompute is turned ON by default when performing a Probabilistic Analysis. Autocompute will automatically compute the model every time a change is made in the Input Data dialog.
In CPillar, the input parameters are entered in the Input Data dialog. The Input Data dialog is organized under four tabs: Geometry, Stresses, Material Properties, and Rock Mass and Abutment Strength. To change a parameter, click on the value and enter the new value or select from the dropdown as necessary. The model will reflect any changes, immediately. Mean values are entered directly in the edit controls in the Input Data dialog.
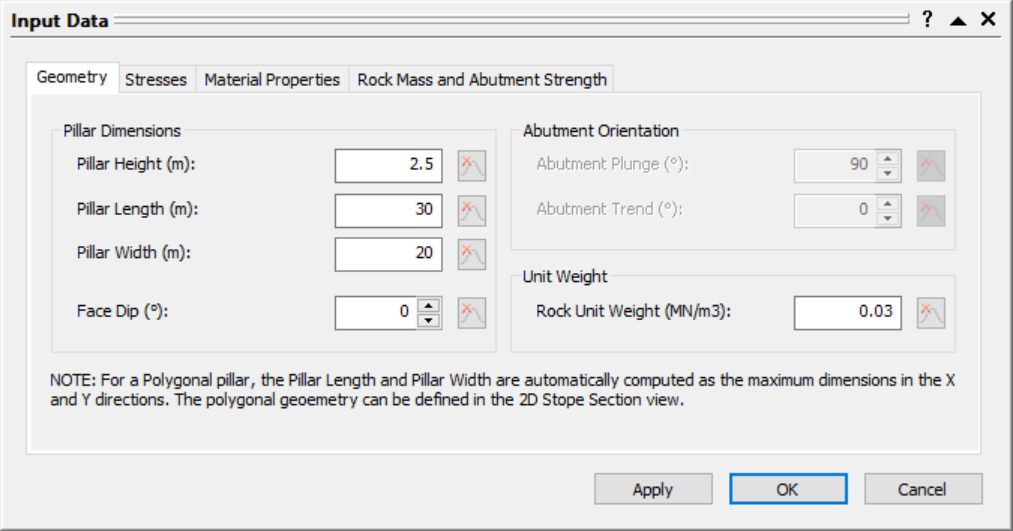
4.1 Geometry
To set up the analysis in the Input Data dialog:
- Select Input Data
 from the toolbar or Analysis menu.
 - Navigate to the Geometry tab.
- Enter the following mean data for the Pillar Dimension parameters:
- Mean Pillar Height = 2.5 m
- Mean Pillar Length = 30 m
- Mean Pillar Width = 20 m
- Mean Face Dip = 0 deg
- Enter the following mean data for the Unit Weight parameter:
- Mean Rock Unit Weight = 0.03 MN/m3
- Mean Rock Unit Weight = 0.03 MN/m3
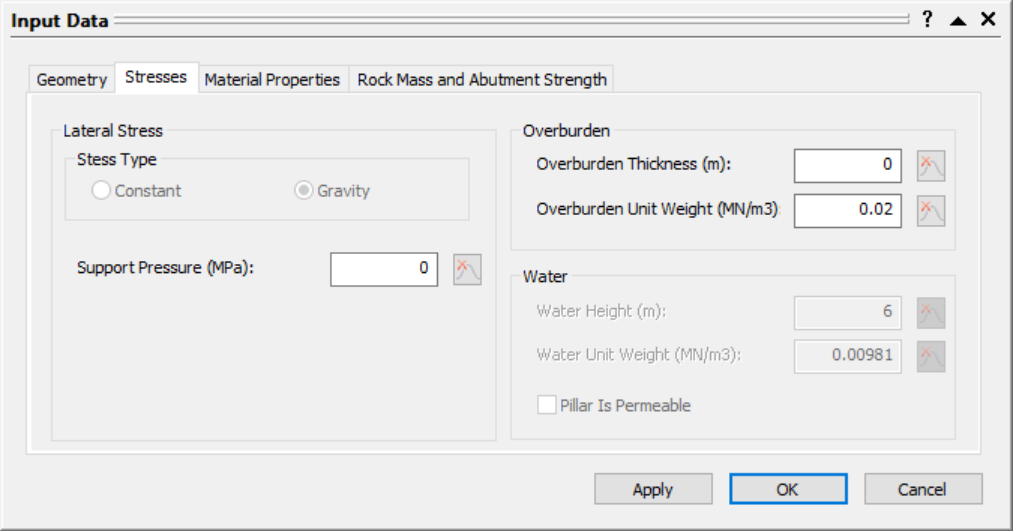
4.2 Stresses
Enter the following mean data for the stress parameters:
- Navigate to the Stresses tab of the Input Data dialog.
- Enter the following mean data for the Lateral Stress parameter:
- Mean Support Pressure = 0 MPa
- Enter the following mean data for the Overburden parameters:
- Mean Overburden Thickness = 0 m
- Mean Overburden Unit Weight = 0.02 MN/m3 (this value has no affect on computations since no overburden is applied)
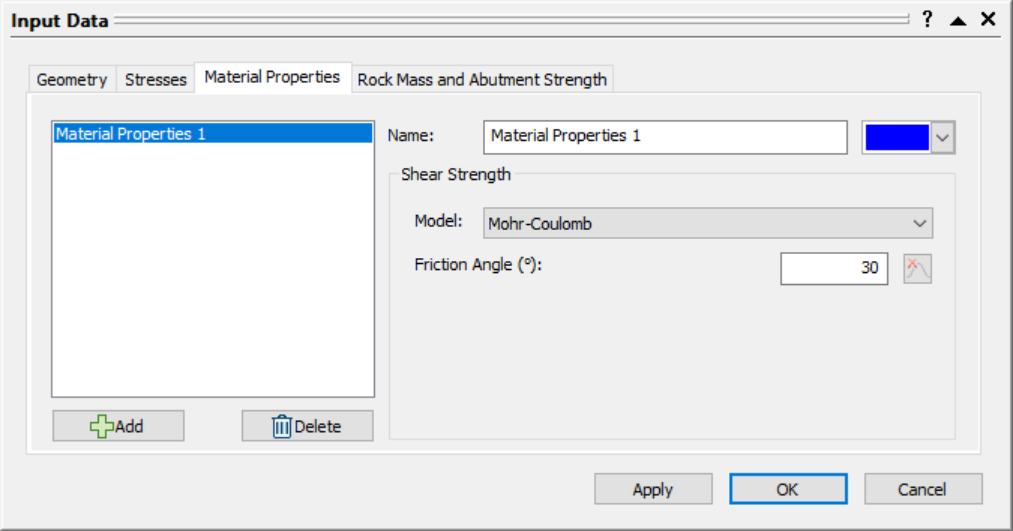
4.3 Material Properties
Enter the following mean data for the shear strength parameters:
- Navigate to the Material Properties tab of the Input Data dialog.
- Enter the following mean data for the Material Properties 1:
- Strength Type = Mohr-Coulomb
- Mean Friction Angle = 30 deg
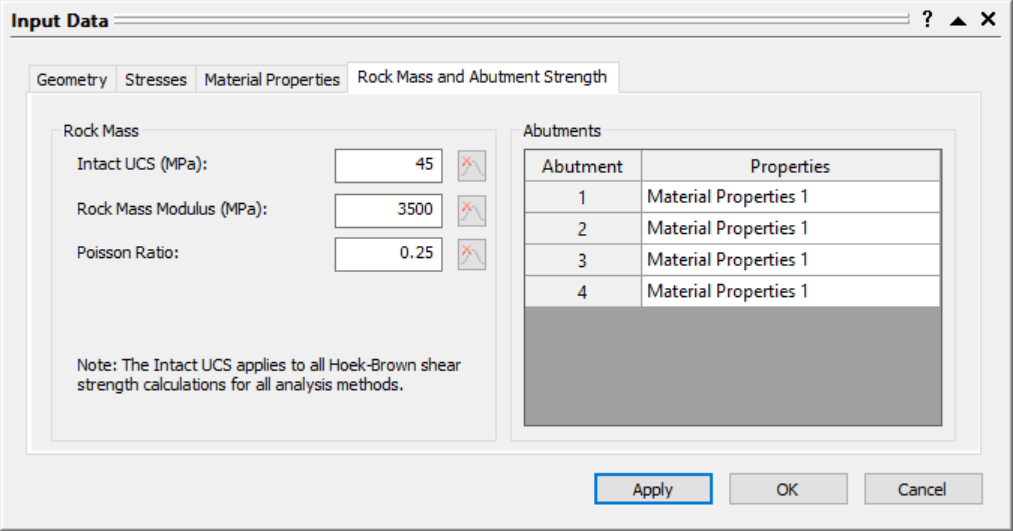
4.4 Rock Mass and Abutment Strength
Enter the following mean data for the rock mass parameters:
- Navigate to the Rock Mass and Abutment Strength tab of the Input Data dialog.
- Enter the following mean data for the Rock Mass parameters:
- Mean Intact UCS = 45 MPa
- Mean Rock Mass Modulus = 3500 MPa
- Mean Poisson Ratio = 0.25
- Click OK to apply the changes and close the dialog.
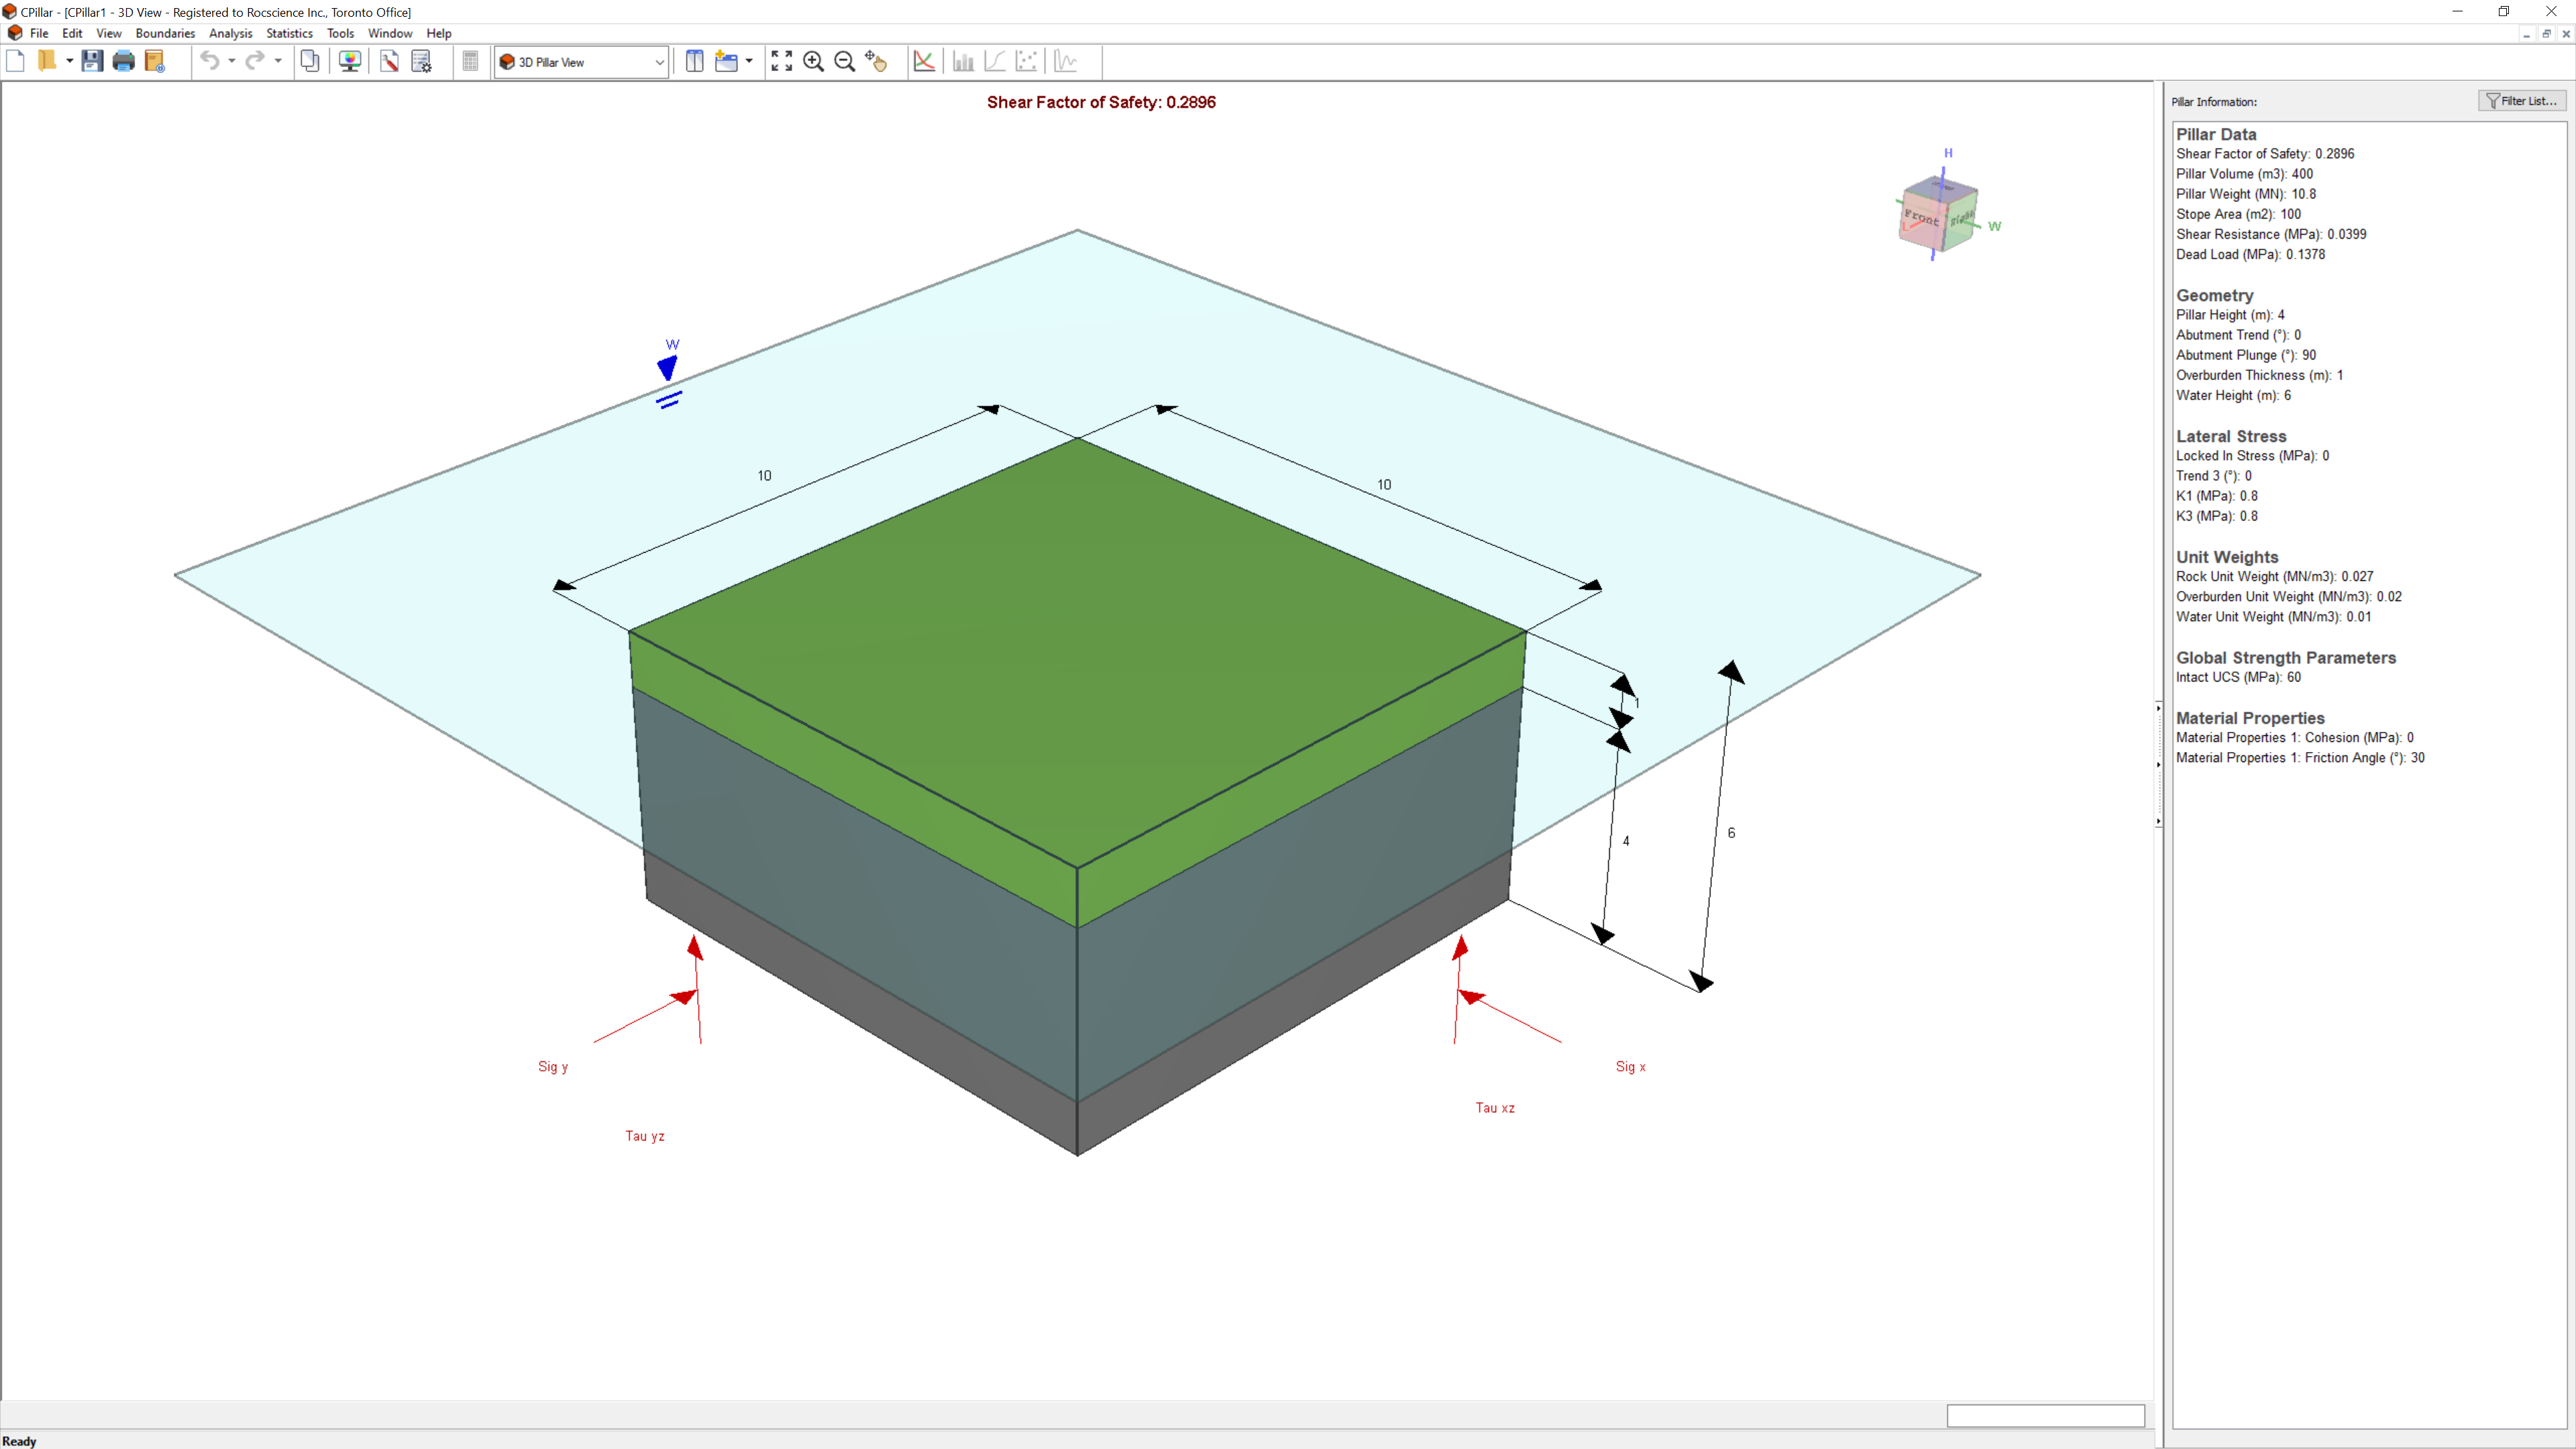
The 3D Pillar View shows an isometric perspective of a 3D pillar model with principal stresses and dimensions labelled:

5.0 Random Variables
In order to perform a Probabilistic analysis, at least one random variable must be assigned a statistical distribution. The Statistical Distribution can be assigned by either:
- Clicking on the distribution icon to the left of the mean parameter value in the Input Data dialog; or
- In the Statistics dialogs.
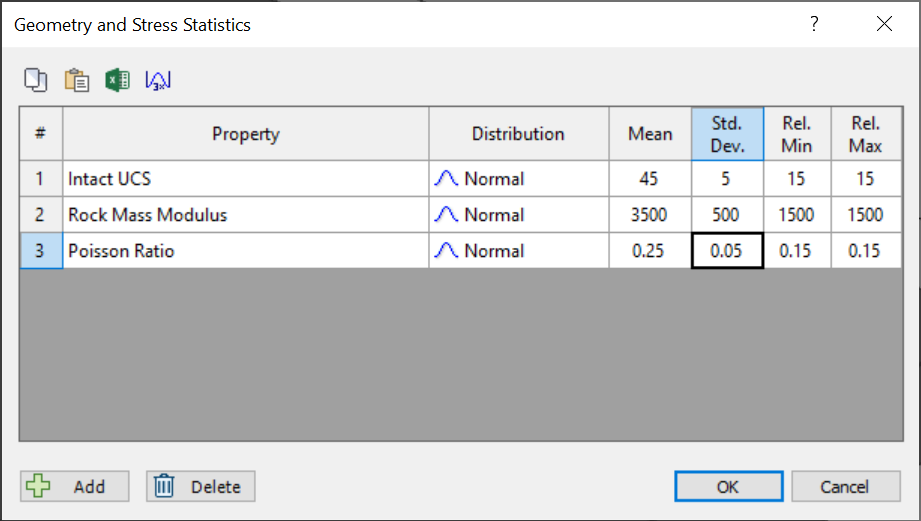
To model the rock mass parameters as random variables in the Geometry and Stress Statistics dialog:
- Select Geometry and Stress
 from the Statistics menu.
 - Click the Add
 button and set the following:
 - Property = Intact UCS
- Distribution = Normal
- Std. Dev. = 5 MPa
- Rel. Min and Rel. Max = 15 MPa
- Click the Add button and set the following:
- Property = Rock Mass Modulus
- Distribution = Normal
- Std. Dev. = 500 MPa
- Rel. Min and Rel. Max = 1500 MPa
- Click the Add button and set the following:
- Property = Poisson Ratio
- Distribution = Normal
- Std. Dev. = 0.05
- Rel. Min and Rel. Max = 0.15
- Select OK.
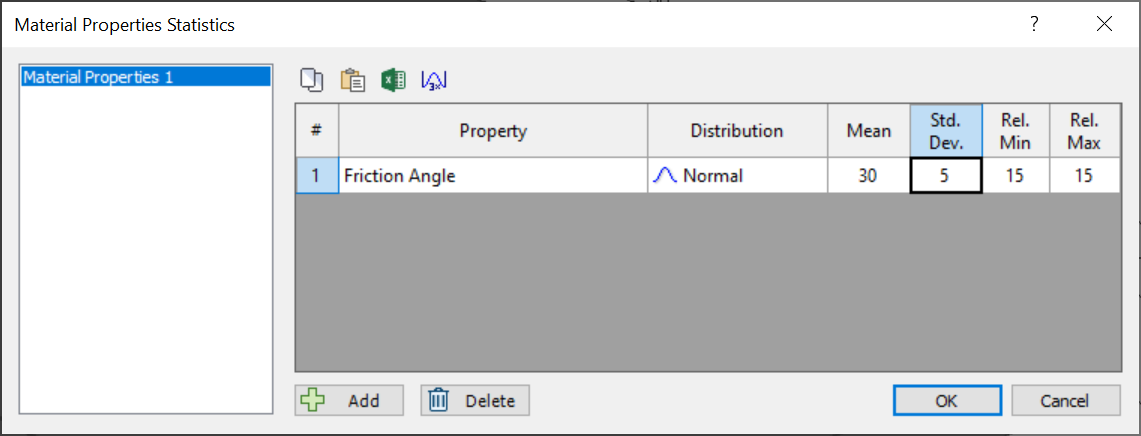
To model the material properties parameters as random variables in the Material Properties Statistics dialog:
- Select Material Properties
 from the Statistics menu.
 - Note that the statistics are assigned per material property. In this case we only have one defined (Material Properties 1).
- Click the Add button and set the following:
- Property = Rock Mass Friction
- Distribution = Normal
- Std. Dev. = 5 deg
- Rel. Min and Rel. Max = 15 deg
- Select OK.
The 3D Pillar View shows an isometric perspective of a probabilistic 3D pillar model with principal stresses and dimensions labelled:

The list of Random Variables defined are listed under Pillar Information in the Sidebar.
6.0 Analysis Results
Since we have Autocompute turned ON, the model is automatically computed and shows the latest analysis results for the current inputs.
The primary result from an CPillar Probabilistic analysis is the pillar Probability of Failure. The Probability of Failure is displayed at the top-center of the 3D Pillar View and in the Pillar Information pane. The Pillar Information pane appears in the Sidebar on the right side of the CPillar application window and displays a summary of analysis results.
Depending on the Analysis Method (i.e., Rigid, Elastic, or Voussoir), additional data is also presented. Note that since this is an Voussoir analysis, three failure modes are considered:
- Shear (vertical slippage at the abutments),
- Arch Snap Thru
- Compression
The Shear Probability of Failure is 0.0064 or 0.64%, and Compression Probability of Failure is 0.0000 or 0%.
For a Voussoir analysis, the Mean Buckling Parameter and Mean Midspan Displacement are also displayed.
The driving force for Arch Snap-Thru buckling is the self-weight of the rock (i.e., pillar). The Mean Buckling Parameter represents the percentage of unstable arch configurations for a given geometry and rock mass modulus. A Buckling Parameter greater than or equal to 35 indicates that the roof is unstable (recall that this was set as the Design Buckling Parameter in Project Settings). The 35 corresponds to a midspan deflection of 10% of the beam thickness. This means that arch stability can also be assessed by monitoring the displacement at midspan, relative to the undeflected state.
The Arch Snap Thru Probability of Failure corresponds to Mean Buckling Parameter ranges as indicated below:
Failure Probability | Mean Buckling Parameter |
Low | 0 to 10 |
Medium | 10 to 25 |
High | 25 to 50 |
Very High | greater than 50 |
The Mean Buckling Parameter is 0, therefore, the Arch Snap Thru Probability of Failure is Low.
The Mean Midspan Displacement is 10.42 mm.
Now we will try to predict the critical plate thickness for the collapse of the arch.
7.0 Collapse of the Arch
Now let’s gradually collapse our arch by decreasing the plate thickness.
7.1 Pillar Height = 1 m
- Select Input Data from the toolbar or Analysis menu.
- Navigate to the Geometry tab.
- Change the Pillar Height = 1 m.
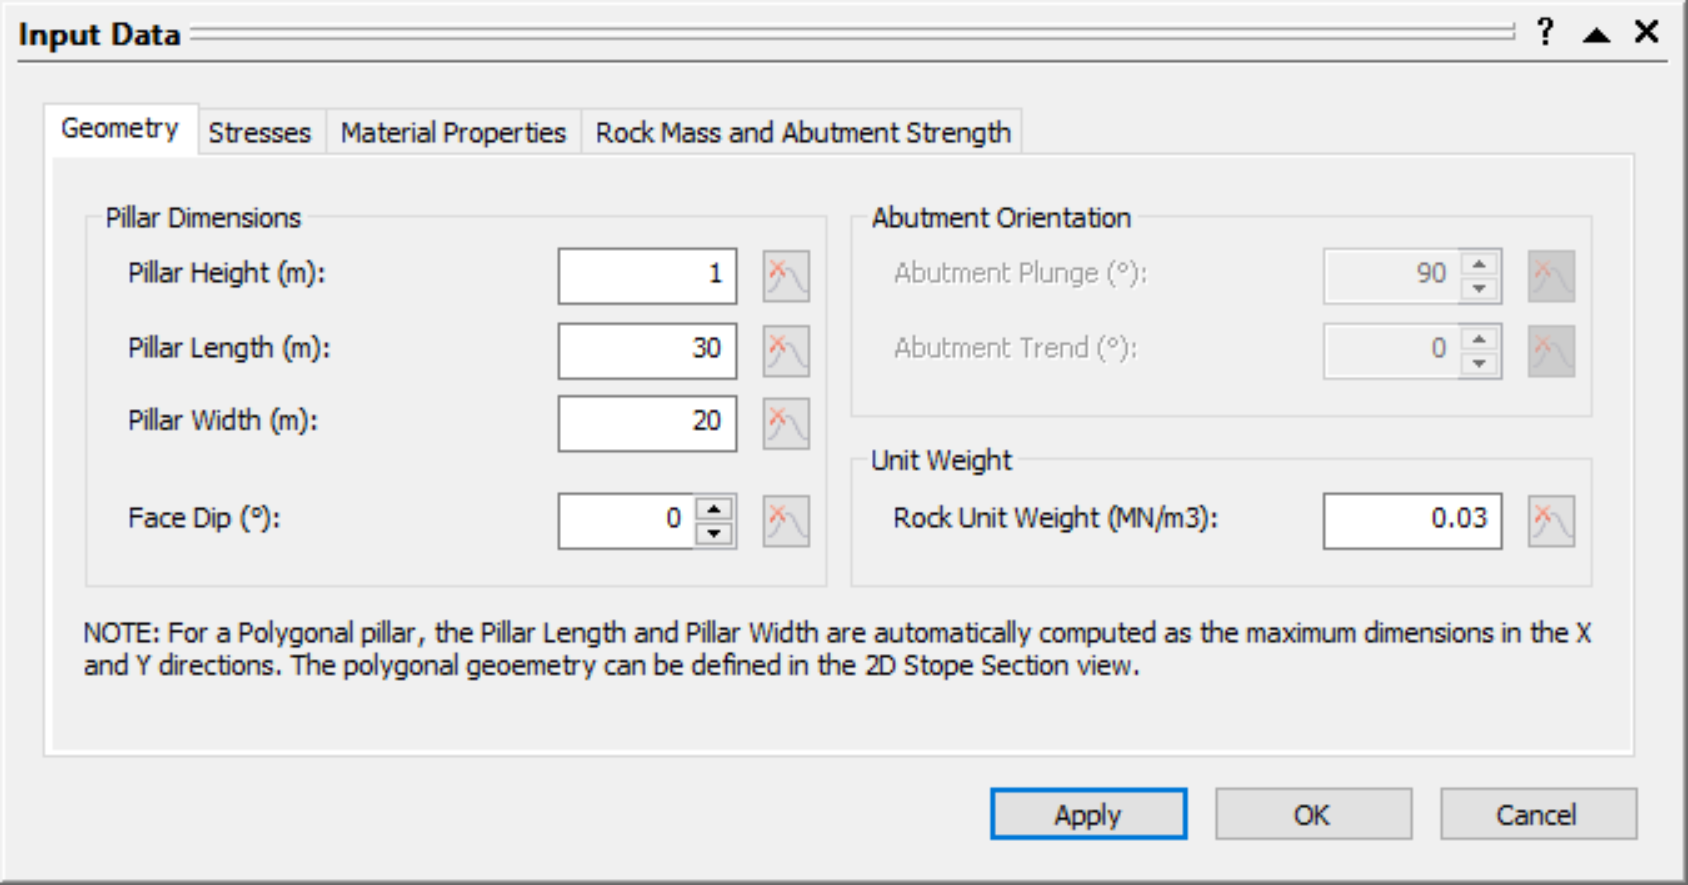
- Select Apply.
The 3D Pillar View shows an isometric perspective of a probabilistic 3D pillar model with Pillar Height = 1 m:

The results are as follows:
- Shear Probability of Failure = 0%
- Arch Snap Thru Probability of Failure = Medium
- Mean Buckling Parameter = 17.734
- Mean Midspan Displacement = 63.55 mm
- Compression Probability of Failure = 0%
Compare the Mean Pillar Data under Pillar Information in the Sidebar. Note that the Shear Factor of Safety increases, while the Compression Factor of Safety decreases. Note also the increase in the arch Midspan Displacement, from 10.42 mm to 63.55 mm. The Probability of Arch Snap-Thru Failure has increased from Low to Medium.
7.2 Pillar Height = 0.8 m
- Select Input Data from the toolbar or Analysis menu.
- Navigate to the Geometry tab.
- Change the Pillar Height = 0.8 m.
- Select Apply.

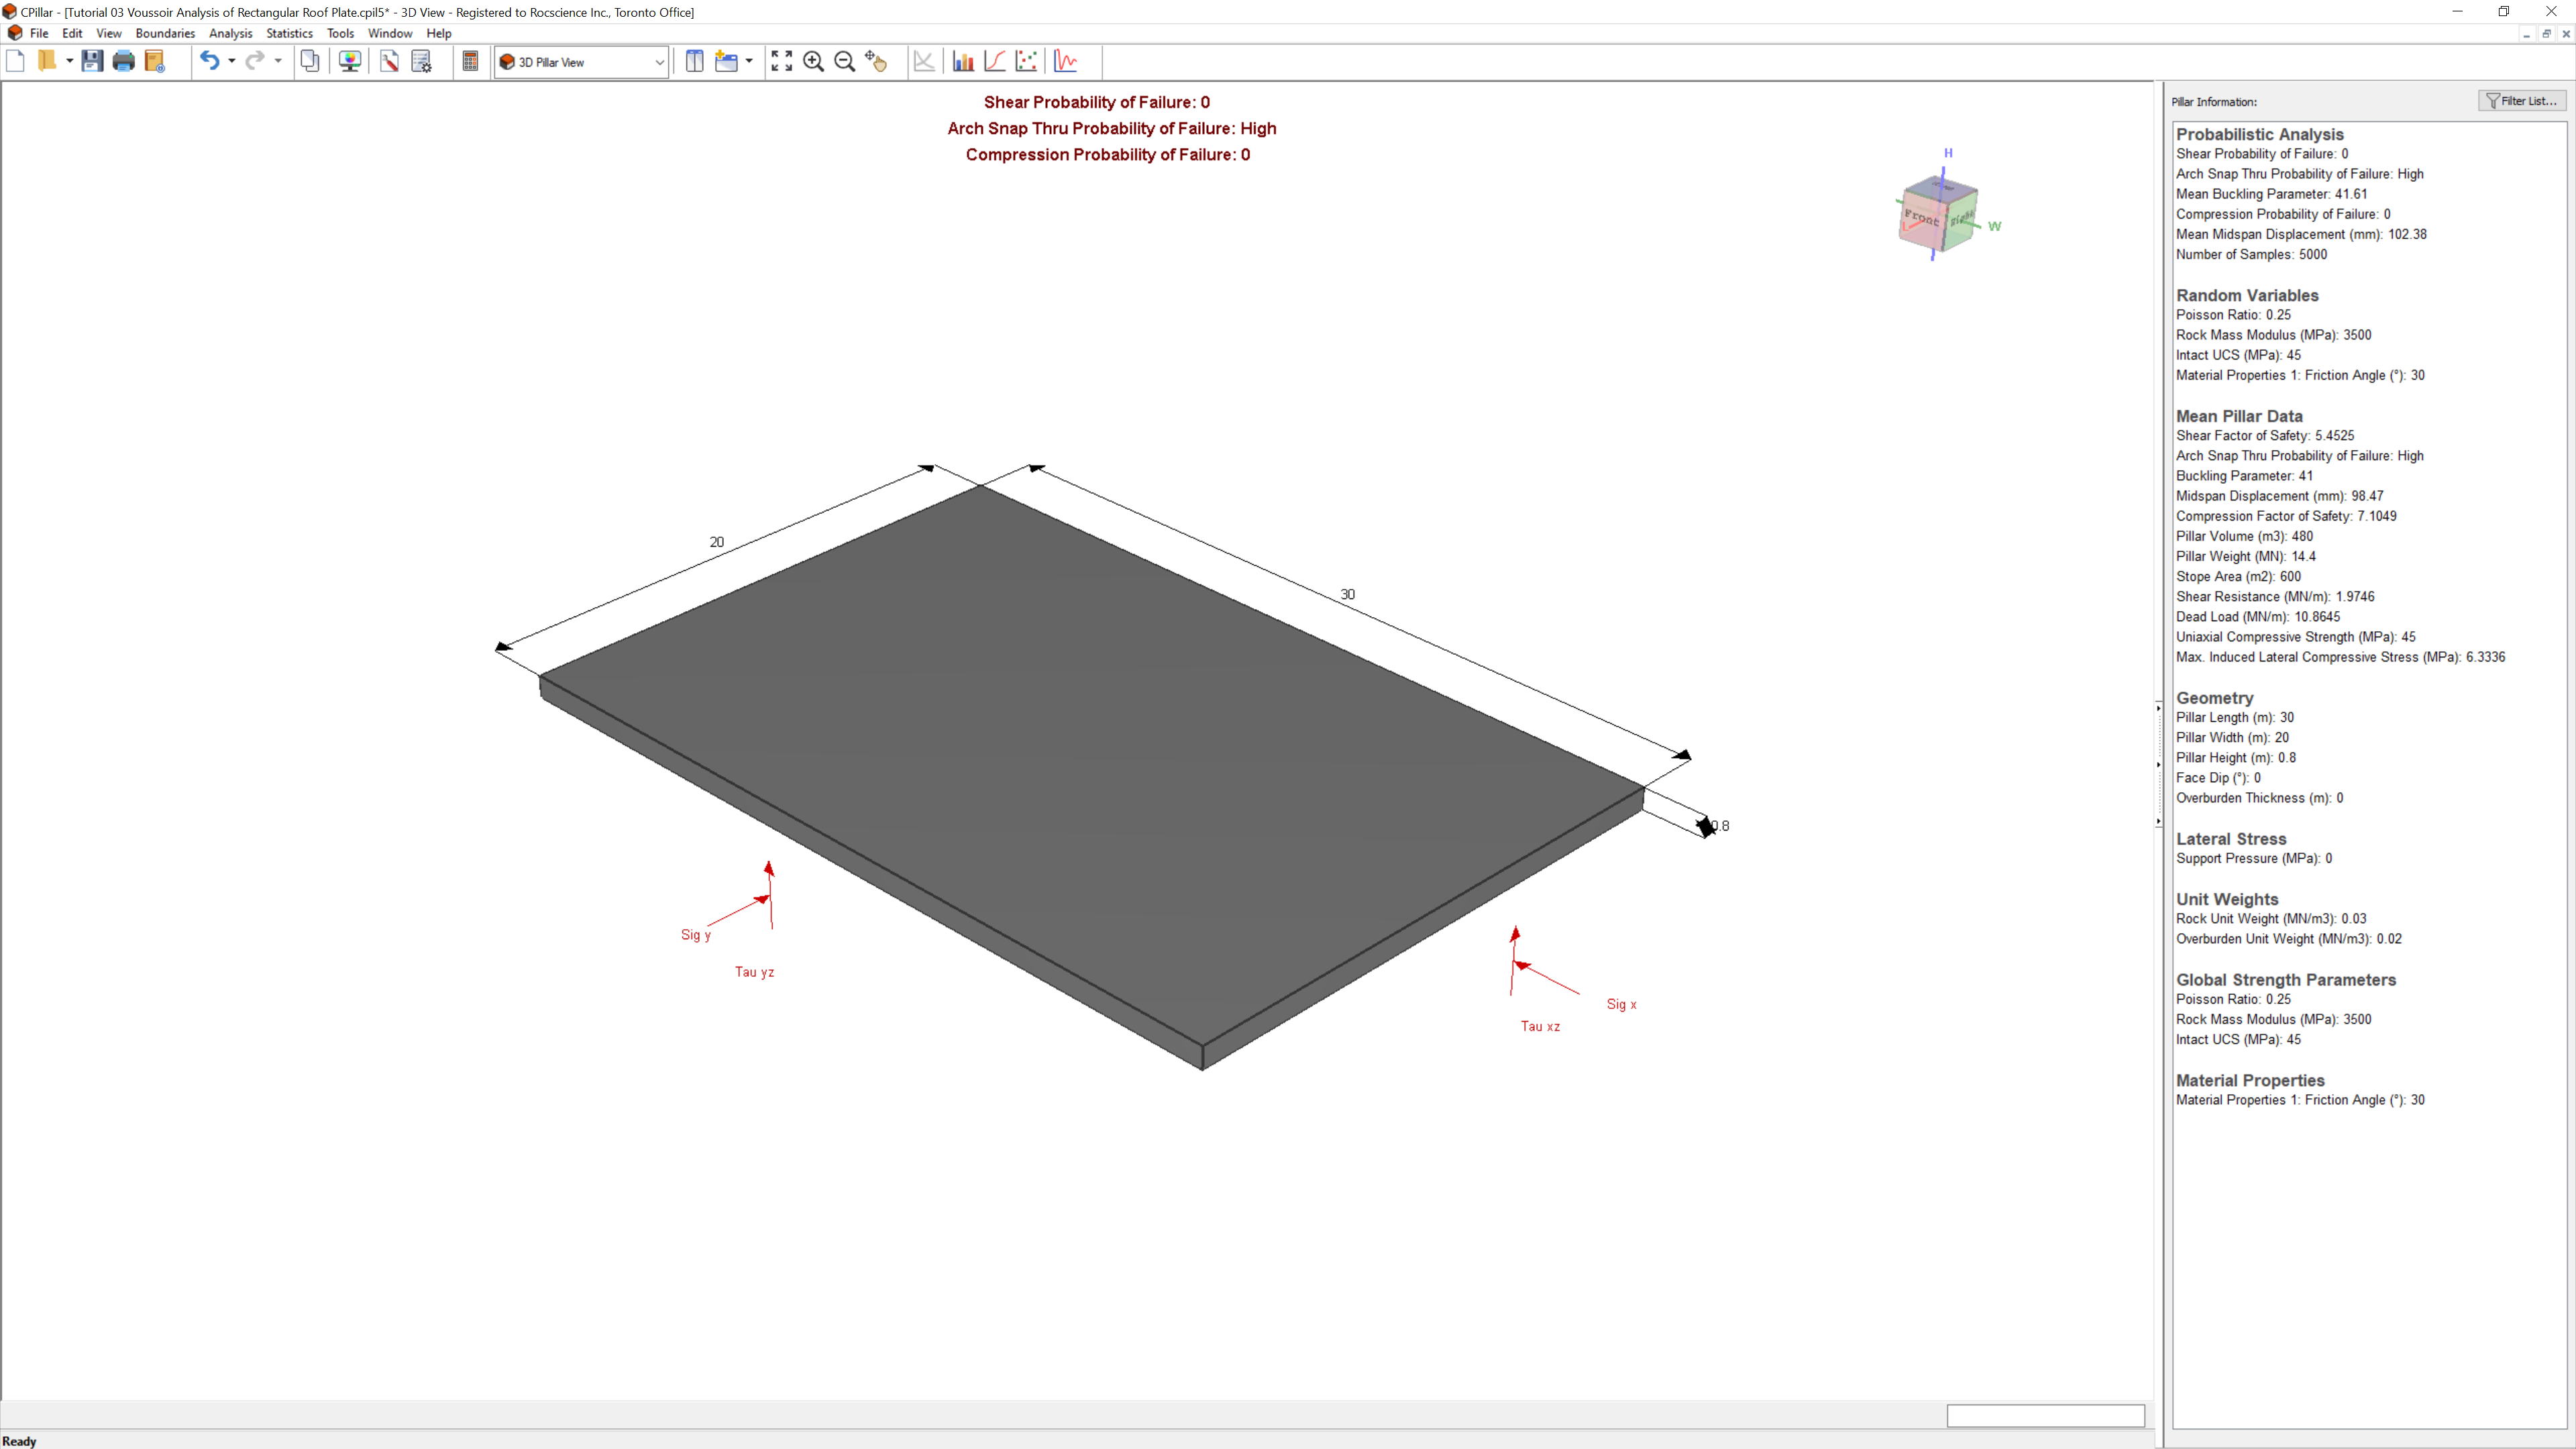
The 3D Pillar View shows an isometric perspective of a probabilistic 3D pillar model with Pillar Height = 0.8 m:
The results are as follows:
- Shear Probability of Failure = 0%
- Arch Snap Thru Probability of Failure = High
- Mean Buckling Parameter = 42.61
- Mean Midspan Displacement = 102.38 mm
- Compression Probability of Failure = 0%
Compare the Mean Pillar Data under Pillar Information in the Sidebar. Note that again, the Shear Factor of Safety increases, while the Compression Factor of Safety decreases. Note also the increase in the arch Midspan Displacement, from 63.55 mm to 102.38 mm. Recall that when the midspan displacement reaches about 10% of the plate or beam height, arch collapse is imminent.
The Probability of Arch Snap-Thru Failure has increased from Medium to High.
7.3 Pillar Height = 0.5 m
Finally, reduce the pillar height to 0.5 m.
- Select Input Data from the toolbar or Analysis menu.
- Navigate to the Geometry tab.
- Change the Pillar Height = 0.5 m.
- Select OK.
The 3D Pillar View shows an isometric perspective of a probabilistic 3D pillar model with Pillar Height = 0.5 m:
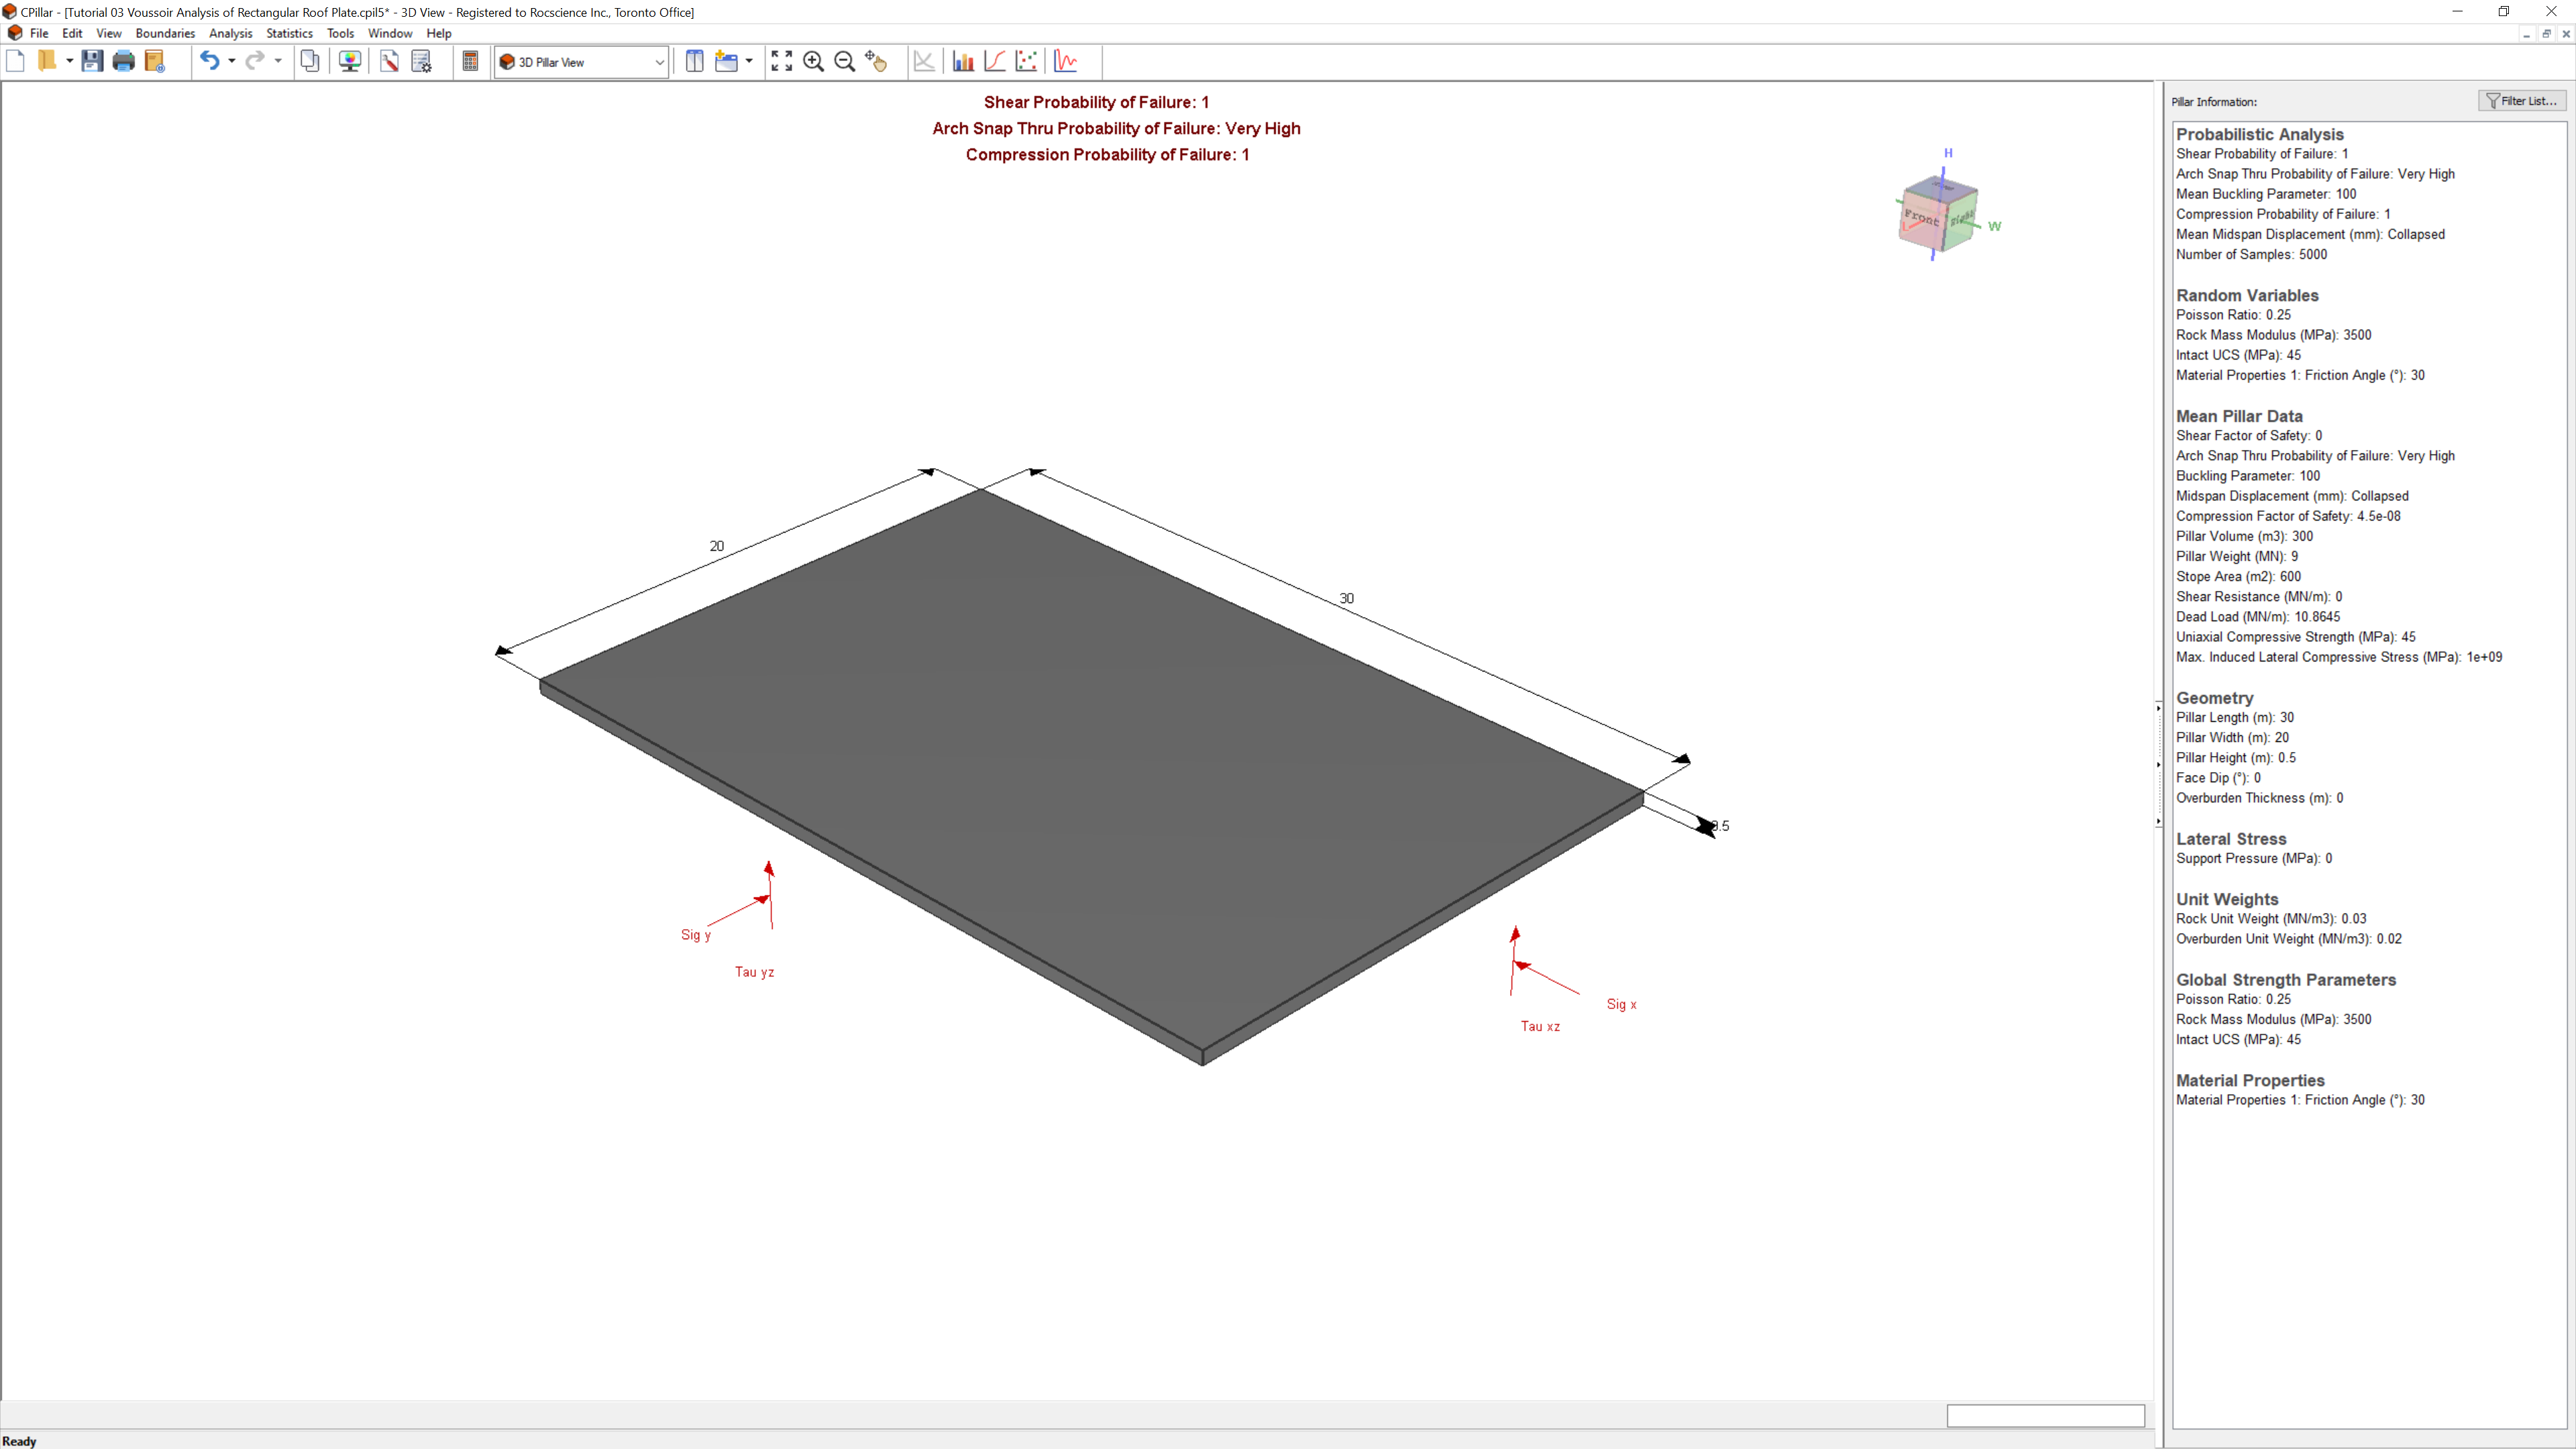
The results are as follows:
- Shear Probability of Failure = 100%
- Arch Snap Thru Probability of Failure = Very High
- Mean Buckling Parameter = 100
- Mean Midspan Displacement = Collapsed
- Compression Probability of Failure = 100%
The Probability of Arch Snap-Thru Failure has increased from High to Very High. The arch is completely unstable, and Probability of Failure is 100%.
This concludes the tutorial. You can now proceed to Tutorial 04: Empirical Scaled Span Approach.